fighting non-deterministic xpcshell unit tests through causality tracking with systemtap; step 1

It’s a story as old as time itself.  You write a unit test.  It works for you.  But the evil spirits in the tinderboxes cause the test to fail.  The trick is knowing that evil spirits are a lot like genies.  When you ask for a wish, genies will try and screw you over by choosing ridiculous values wherever you forgot to constrain things.  For example, I got my dream job, but now I live in Canada.  The tinderbox evil spirits do the same thing, but usually by causing pathological thread scheduling.

This happened to me the other day and a number of our other tests are running slower than they should, so I decided it was time for another round of incremental amortized tool-building.  Building on my previous systemtap applied to mozilla adventures by porting things to the new JS representations in mozilla-2.0 and adding some new trace events I can now generate traces that:

  • Know when the event loop is processing an event.  Because we reconstruct a nested tree from our trace information and we have a number of other probes, we can also attribute the event to higher-level concepts like timer callbacks.
  • Know when a new runnable is scheduled for execution on a thread or a new timer firing is scheduled, etc.  To help understand why this happened we emit a JS backtrace at that point.  (We could also get a native backtrace cheaply, or even a unified backtrace with some legwork.)
  • Know when high-level events occur during the execution of the unit test.  We hook the dump() implementations in the relevant contexts (xpcshell, JS components/modules, sandboxes) and then we can listen in on all the juicy secrets the test framework shouts into the wind.  What is notable about this choice of probe point is that it:
    • is low frequency, at least if you are reasonably sane about your output.
    • provides a useful correlation between what it is going on under the hood with something that makes sense to the developer.
    • does not cause the JS engine to need to avoid tracing or start logging everything that ever happens.

Because we know when the runnables are created (including what runnable they live inside of) and when they run, we are able to build what I call a causality graph because it sounds cool.  Right now this takes the form of a hierarchical graph.  Branches form when a runnable (or the top-level) schedules more than one runnable during the execution of a single runnable.  The dream is to semi-automatically (heuristics / human annotations may be required) transform the hierarchical graph into one that merges these branches back into a single branch when appropriate.  Collapsing linear runs into a single graph node is also desired, but easy.  Such fanciness may not actually be required to fix test non-determinism, of course.

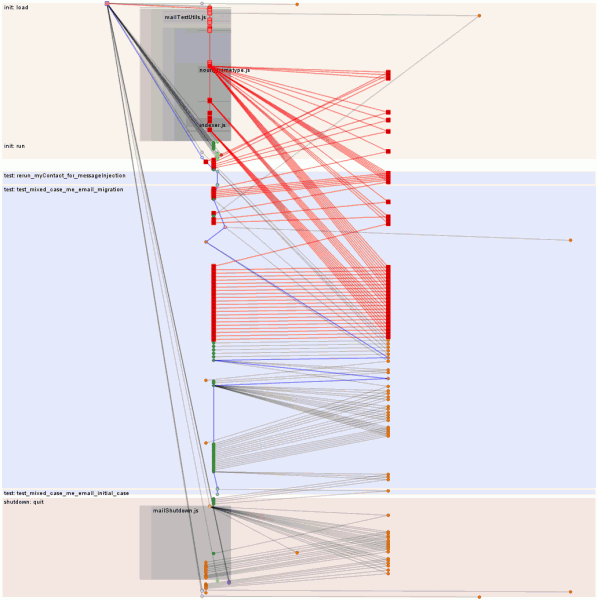
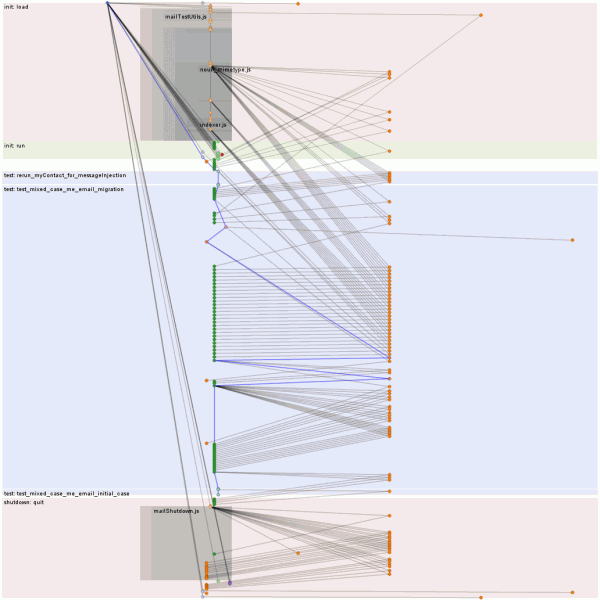
The protovis-based visualization above has the following exciting bullet points describing it:

  • Time flows vertically downwards.  Time in this case is defined by a globally sequential counter incremented for each trace event.  Time used to be the number of nanoseconds since the start of the run, but there seemed to somehow be clock skew between my various processor cores that live in a single chip.
  • Horizontally, threads are spaced out and within those threads the type of events are spaced out.
    • The weird nested alpha grey levels convey nesting of JS_ExecuteScript calls which indicates both xpcshell file loads and JS component/module top-level executions as a result of initial import.  If there is enough vertical space, labels are shown, otherwise they are collapsed.
  • Those sweet horizontal bands convey the various phases of operation and have helpful labels.
  • The nodes are either events caused by top-level runnable being executed by the event loop or important events that merit the creation of synthetic nodes in the causal graph.  For example, we promote the execution of a JS file to its own link so we can more clearly see when a file caused something to happen.  Likewise, we generate new links when analysis of dump() output tells us a test started or stopped.
  • The blue edges are expressing the primary causal chain as determined by the dump() analysis logic.  If you are telling us a test started/ended, it only follows that you are on the primary causal chain.
  • If you were viewing it in a web browser, you could click on the nodes and it would console.log them and then you could see what is actually happening in there.  If you hovered over nodes they would also highlight their ancestors and descendents in various loud shades of red.

  • The specific execution being visualized had a lot of asynchronous mozStorage stuff going on.  (The right busy thread is the asynchronous thread for the database.)  The second image has the main init chain hovered, resulting in all the async fallout from the initialization process being highlighted in red.  At first glance it’s rather concerning that the initialization process is still going on inside the first real test.  Thanks to the strict ordering of event queues, we can see that everything that happens on the primary causal chain after it hops over to the async thread and back is safe because of that ordering.  The question is whether bad things could happen prior to that joining.  The answer?  In another blog post, I fear.
    • Or “probably”, given that the test has a known potential intermittent failure.  (The test is in dangerous waters because it is re-triggering synchronous database code that normally is only invoked during the startup phase before references are available to the code and before any asynchronous dispatches occur.  All the other tests in the directory are able to play by the rules and so all of their logic should be well-ordered, although we might still expect the initialization logic to likewise complete in what is technically a test phase.  Since the goal is just to make tests deterministic (as long as we do not sacrifice realism), the simplest solution may just be to force the init phase to complete before allowing the tests to start.  The gloda support logic already has an unused hook capable of accomplishing this that I may have forgotten to hook up…

Repo is my usual systemtapping repo.  Things you might type if you wanted to use the tools follow:

  • make SOLO_FILE=test_name.js EXTRA_TEST_ARGS=”–debugger /path/to/tb-test-help/systemtap/chewchewwoowoo.py –debugger-args ‘/path/to/tb-test-help/systemtap/mozperfish/mozperfish.stp –‘” check-one
  • python /path/to/tb-test-help/chewchewwoowoo.py –re-run=/tmp/chewtap-##### mozperfish/mozperfish.stp /path/to/mozilla/dist/bin/xpcshell

The two major gotchas to be aware of are that you need to: a) make your xpcshell build with jemalloc since I left some jemalloc specific memory probes in there, and b) you may need to run the first command several times because systemtap has some seriously non-deterministic dwarf logic going on right now where it claims that it doesn’t believe that certain types are actually unions/structs/whatnot.

work-in-progress tooling: feeding GWT SpeedTracer systemtapped mozilla performance data

Now that Thunderbird 3.1 is string/feature-frozen it’s time to focus on performance.  This post is just to make sure that people who are also working on similar things know what I’m up to.  For example, there’s some very exciting work going on involving adding a startup timeline to mozilla-central that everyone keeping up-to-date with mozilla performance work should be aware of.  In summary, no results yet, but soon!

The big bullet points for now are:

  • GWT SpeedTracer is a very impressive tool.
  • I have seriously cleaned up / automated my previous SystemTap script work for mozilla.  Invoking python chewchewwoowoo.py speedtracer/mozspeedtrace.stp `pgrep thunderbird-bin` does the following:
    • generates a version of the source script with any line statements fixed up based on one or more line seeks in a file.
    • builds the command line and invokes the system tap script.
    • invokes a post-processing script specified in the tap file, feeding it address-translation helpers and systemtap bulk logging per-cpu fusion.
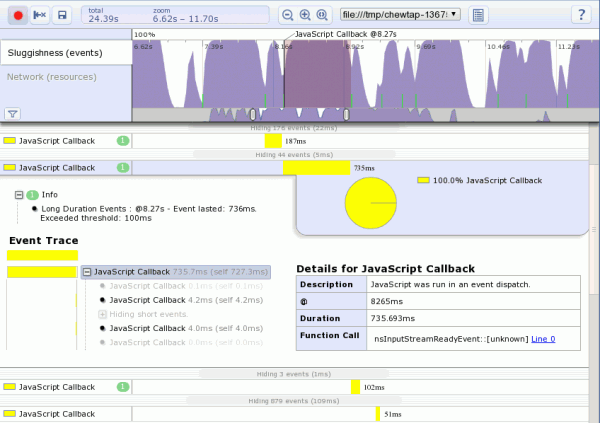
  • mozspeedtrace.stp and its post-processor produce an HTML file with embedded JSON that the SpeedTracer Chrome extension recognizes as one of its own.  (SpeedTracer runs in Firefox through the GWT development mode, but being very new to GWT I am not yet clear on if/how to be able to wrap it up to be used as a webapp from static data.)
  • My mapping of events as recorded by my SystemTap probes to SpeedTracer events is somewhat sketchy, but part of that is due to the limited set of events and their preconfigured display output.  (I believe it turns out I can generate optional data like fake stack traces to be able to expand the set of mapped events without having to modify SpeedTracer.)  This is way basically everything in the screenshot is a yellow ‘JavaScript Callback’.
  • I have not implemented probes for all of the event types defined by SpeedTracer, I have not ported all of my previous probes yet, and there are still some new probes yet to add.  Happily, most of the hard work is already in the can.
  • The motivation behind this is very different from the startup timeline.  Thunderbird uses mozilla-1.9.2, not mozilla-central, and my primary investigatory focus is memory usage in steady-state after start-up, not the time it takes to start up.  (We do, of course, want to improve performance where possible.)  It just so happens that in order to usefully explain who is allocating memory we also have to know who is active at the time / why they are active, and that provides us with the performance timeline data.
  • This work is not likely to be useful for per-tab/webpage performance data gathering… just whole-program performance investigation like Thunderbird needs.
  • This is a work-in-progress, but the focus is on improving Thunderbird’s performance issues, not building tooling.  As such, I may have to bail on SpeedTracer in favor of command-line heuristic analysis if I can’t readily modify SpeedTracer to suit my needs.  I picked SpeedTracer partially to (briefly) investigate GWT, but from my exploration of the code thus far, the activation energy required may be too great.

performance annotated SQLite EXPLAINation visualizations using systemtap

For the Thunderbird 3.1 release cycle we are not just fixing UX problems but also resolving various performance issues.  Building on my previous work on a visualization of SQLite opcode control flow graphs using graphviz I give you… the same thing!  But updated to more recent versions of SQLite and integrating performance information retrieved through the use of systemtap with utrace.

In this case we are using systemtap to extract the number of times each opcode is executed and the number of btree pages that are requested during the course of executing the opcode.  (We do not differentiate between cache hits and misses because we are looking at big-O right now.)  Because virtual tables (like those used by FTS3) result in nested SQLite queries and we do not care about analyzing the queries used by FTS3, we ignore nested calls and attribute all btree page accesses to the top-level opcode under execution.

Because the utility of a tool is just as dependent on ease of use as its feature set, I’ve cleaned things up and made it much easier to get information out of Thunderbird/gloda with this patch which should land soon and provides the following:

  • The gloda datastore will write a JSON file with the EXPLAINed results of all its SQL queries to the path found in the preference mailnews.database.global.datastore.explainToPath.  This preference is observed so that setting it during runtime will cause it to create the file and begin explaining all subequently created queries.  Clearing/changing the preference closes out the current file and potentially opens a new one.
  • Gloda unit tests will automatically set the preference to the value of the environment variable GLODA_DATASTORE_EXPLAIN_TO_PATH if set.
  • A schema dump is no longer required for meta-data because we just assume that you are using a SQLite DEBUG build that tells us everything we want to know about in the ‘comment’ column.
  • grokexplain.py now uses optparse and has more internal documentation and such.

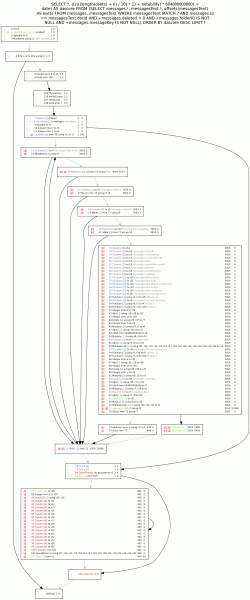
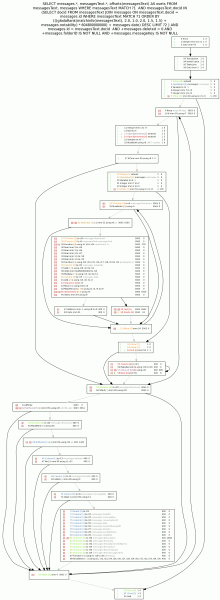
So what do the pretty pictures show?

  • Before: A gloda fulltext query search retrieves all of the results data before applying the LIMIT.  This results in a lot more data transplanted into temporary results tables than we will end up using; wasted bookkeeping.  Additionally, we incur the row lookup costs for both our messages data storage table and our fulltext messagesText table for all hits, even the ones we will not return.  (Noting that there was no escaping hitting both tables since we were using offsets() and it hits the fulltext table as part of its operation.)
  • After: We perform an initial query phase where we minimize wasted bookkeeping by only retrieving and using the bare minimum required to compute the LIMITed list of document id’s.  Additionally, by use of the FTS3 matchinfo() function instead of the offsets() function we are able to avoid performing row lookup on the messagesText table for results that will not be returned to the user.  Use of the matchinfo() function requires a custom ranking function which allows us to be somewhat more clever about boosting results based on fulltext matches too.
  • The poor man’s bar graphs in the pictures are expressing a hand-rolled logarithmic scale for the number of invocations (left bar) and number of btree pages accessed (right bar).  On the right side of each line the actual numbers are also presented in the same order.  The goal is not to convey good/bad so much as to draw the eye to hot spots.

Notes for people who want more to read:

  • SQLite has built-in infrastructure to track the number of times an opcode is executed as well as the wall-clock time used; you do not have to use systemtap.  It’s a conditional compilation kind of thing, just -DVDBE_PROFILE and every statement you execute gets its performance data appended to vdbe_profile.out when you reset the statement.  It doesn’t do the btree pages consulted trick, but it’s obviously within its power with some code changes.
  • Our use of systemtap is primarily a question of discretionary reporting control, the ability to integrate the analysis across other abstraction layers, and various build concerns.  The JSON output is not a driving concern, just something nice we are able to do for ourselves since we are formatting the output.
  • The tool has really crossed over into the super-win-payoff category with this fix investigation.  (Having said that, I probably could have skipped some of the data-flow stuff last time around.  But these projects are both for personal interest and amusement as well as practical benefit, so what are you gonna do?  Also, that effort could pay off a bit more by propagating comments along register uses so that the LIMIT counter register r8 and the compute-once r7 in the after diagram would not require human thought.)

References:

  • The grokexplain repo.  Used like so: python grokexplain.py –vdbe-stats=/tmp/glodaNewSearchPerf.json /tmp/glodaNewSearchExplained.json -o /tmp/glodasearch-newcheck
  • The systemtap script in its repo.  Used like so: sudo stap -DMAXSTRINGLEN=1024 sqlite-perf.stp /path/to/thunderbird-objdir/mozilla/dist/lib/libsqlite3.so > /tmp/glodaNewSearchPerf.json
  • The bug with the gloda explain logic patch and the improved SQL query logic.  I also used the tooling to fix another (now-fixed) bug, but that problem turned out to be less interesting.

Using systemtap to figure what your mozilla app’s event loop is up to

====================                                             ms    #
----- Event Loop:
  nsTimerEvent                                                 1233   31
  nsProxyObjectCallInfo                                          19   44
  nsStreamCopierOB                                                1   48
  nsStreamCopierIB                                                0   18
  nsProxyCallCompletedEvent                                       0   44
  nsProxyReleaseEvent                                             0   27
  nsTransportStatusEvent                                          0   19
  nsSocketEvent                                                   0   18
  nsHttpConnectionMgr::nsConnEvent                                0    1
----- Timers:
  OnBiffTimer(...)                                             1129    3
  nsGlobalWindow::TimerCallback(...)                             70   10
  nsAutoSyncManager::TimerCallback(...)                          29    6
  nsExpirationTracker::TimerCallback(...)                         1    1
  nsIdleService::IdleTimerCallback(...)                           0    5
  nsExpirationTracker::TimerCallback(...)                         0    1
  nsHttpHandler                                                   0    1
  nsUITimerCallback                                               0    2
  imgContainer::sDiscardTimerCallback(...)                        0    1
  nsExpirationTracker::TimerCallback(...)                         0    1

That’s one of the periodic outputs (10 seconds currently) of this systemtap script filtered through this python script to translate addresses to useful symbol names in realtime.  It’s like top for mozilla.

Actual invocation looks like so:
sudo stap -v moz-event-loop.stp /path/to/thunderbird/objdir/mozilla/dist/lib/libxpcom_core.so | ../addrsymfilt.py `pgrep thunderbird-bin`

The giant caveat (and giant hooray for utrace and Fedora having kernels with the utrace patches built-in) is that the magic in here is done dynamically using utrace source line probes.  As such, the probes aren’t resilient in the face of changes to the underlying source files; the current line numbers are targeted at 1.9.2.  There are various in-tree and out-of-tree solutions possible.

prototype unified JavaScript/C++ back-traces for Mozilla in (archer) gdb

fused-js-cpp-backtrace-2-upper-half

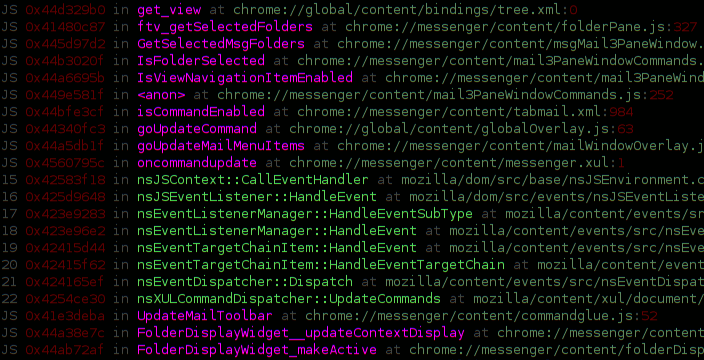
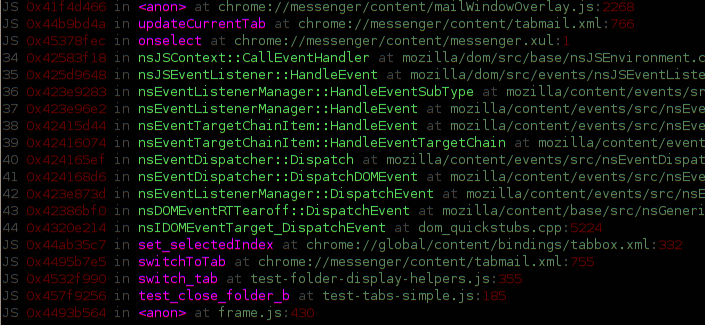
As far as I know (and ignoring my previous efforts on chroniquery along these lines), up until now you had your C/C++ Mozilla backtraces via gdb (chocolate) and your JS backtraces via “call DumpJSStack()” or the debugger keyword from within JS (peanut butter), but these two great flavors had never come together to make a lot of money for dentists.

The screenshots (which is actually just one screenshot split in two) show invocation of a custom python gdb command building on my previous exciting pretty gdb commands.  The command has filtered out boring JS interpreter / XPConnect code and interleaved exciting interesting JS stack frames.

The implementation is reasonably simple and intended to be able to be implemented using VProbes to support my recent performance work along those lines.  We walk stack frames the usual way.  Ahead of time, we have marked out the PC ranges of interesting JS interpreter functions (js_Interpret and js_Execute).  If the stack frame’s instruction pointer is in one of those functions we grab the JSContext argument.  We pop frames until we reach the native frame those functions allocate from their own stack space (whose boundaries we know from the stack walking).

There is one trick we have to do involving dormantFrameChain.  While js_Execute has a consistent and straightforward usage of JS_SaveFrameChain, XPConnect and its quickstub friends are more complex.  Right now we use a dumb heuristic that just looks if our frame pointer is 0 and there is a dormantFrameChain, and in that case we restore it.  (Thankfully the garbage collector needs to know about the shelved frames, otherwise we might have to chase frames down.)  I haven’t put much effort into thinking about it, but the heurstic seems a bit reckless.  We could likely just concurrently walk the XPConnect context stack to figure out when to restore dormant frame chains.  The existing VProbe JS stack (only) code already goes to the horrible effort to get at the thread-local stack, so it wouldn’t be too much more work.  Things probably also fall down during garbage collection right now.

Hg repository is here.  Under no circumstances try to use this with jblandy’s excellent archer-mozilla JS magic right now.  The current code is very distrustful of gdb.Value in a dumb way and does exceedingly dangerous things wherein pointers are bounced to strings and back to integers because direct integer coercion is forbidden.  With pretty printers installed this is likely to break.  Also, this is all only tested on 1.9.1.

fused-js-cpp-backtrace-2-lower-half

Using VMWare Record/Replay and VProbes for low time-distortion performance profiling

profile-performance-graph-enumerateProps

The greatest problem with performance profiling is getting as much information as possible while affecting the results as little as possible.  For my work on pecobro I used mozilla’s JavaScript DTrace probes.  Because the probes are limited to notifications of all function invocations/returns with no discretion and there is no support for JS backtraces, the impact on performance was heavy.  Although I have never seriously entertained using chronicle-recorder (via chroniquery) for performance investigations, it is a phenomenal tool and it would be fantastic if it were usable for this purpose.

VMware introduced with Workstation 6/6.5 the ability to efficiently record VM execution by recording the non-deterministic parts of VM execution.  When you hit the record button it takes a snapshot and then does its thing.  For a 2 minute execution trace where Thunderbird is started up and gloda starts indexing and adaptively targets for 80% cpu usage, I have a 1G memory snapshot (the amount of memory allocated to the VM), a 57M vmlog file, and a 28M vmsn file.  There is also and a 40M disk delta file (against the disk snapshot), but I presume that’s a side effect of the execution rather than a component of it.

The record/replay functionality is the key to being able to analyze performance while minimizing the distortion of the data-gathering mechanisms.  There are apparently a lot of other solutions in the pipeline, many of them open source.  VMware peeps apparently also created a record/replay-ish mechanism for valgrind, valgrind-rr, which roc has thought about leveraging for chronicle-recorder.  I have also heard of Xen solutions to the problem, but am not currently aware of any usable solutions today.  And of course, there are many precursors to VMware’s work, but this blog post is not a literature survey.

There are 3 ways to get data out of a VM under replay, only 2 of which are usable for my purposes.

  1. Use gdb/the gdb remote target protocol.  The VMware server opens up a port that you can attach to.  The server has some built-in support to understand linux processes if you spoon feed it some critical offsets.  Once you do that, “info threads” lists every process in the image as a thread which you can attach to.  If you do the dance right, gdb provides perfect back-traces and you can set breakpoints and generally do your thing.  You can even rewind execution if you want, but since that means restoring state at the last checkpoint and running execution forward until it reaches the right spot, it’s not cheap.  In contrast, chronicle-recorder can run (process) time backwards, albeit at a steep initial cost.
  2. Use VProbes.  Using a common analogy, dtrace is like a domesticated assassin black bear that comes from the factory understanding English and knowing how to get you a beer from the fridge as well as off your enemies.  VProbes, in contrast, is a grizzly bear that speaks no English.  Assuming you can convince it to go after your enemies, it will completely demolish them.  And you can probably teach it to get you a beer too, it just takes a lot more effort.
  3. Use VAssert.  Just like asserts only happen in debug builds, VAsserts only happen during replay (but not during recording).  Except for the requirement that you think ahead to VAssert-enable your code, it’s awesome because, like static dtrace probes, you can use your code that already understands your code rather than trying to wail on things from outside using gdb or the like.  This one was not an option because it is Windows only as of WS 6.5.  (And Windows was not an option because building mozilla in a VM is ever so slow, and, let’s face it, I’m a linux kind of guy.  At least until someone buys me a solid gold house and a rocket car.)

profile-performance-graph-callbackDriver-doubleClicked

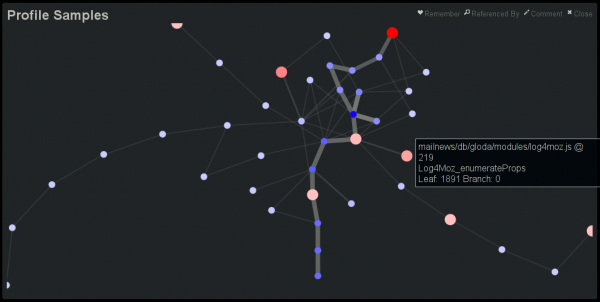
My first step in this direction has been using a combination of #1 and #2 to get javascript backtraces using a timer-interval probe.  The probe roughly does the following:

  • Get a pointer to the current linux kernel task_struct:
    • Assume we are uniprocessor and retrieve the value of x86_hw_tss.sp0 from the TSS struct for the first processor.
    • Now that we know the per-task kernel stack pointer, we can find a pointer to the task_struct at the base of the page.
  • Check if the name of our task is “thunderbird-bin” and bail if it is not.
  • Pull the current timestamp from the linux kernel maintained xtime.  Ideally we could use VProbe’s getsystemtime function, but it doesn’t seem to work and/or is not well defined.  Our goal is to have a reliable indicator of what the real time is at this stage in the execution, because with a rapidly polling probe our execution will obviously be slower than realtime.  xtime is pretty good for this, but ticks at 10ms out of box (Ubuntu 9.04 i386 VM-targeted build), which is a rather limited granularity.  Presumably we can increase its tick rate, but not without some additional (though probably acceptable) time distortion.
  • Perform a JS stack dump:
    • Get XPConnect’s context for the thread.
      • Using information from gdb on where XPCPerThreadData::gTLSIndex is, load the tls slot.  (We could also just directly retrieve the tls slot from gdb.)
      • Get the NSPR thread private data for that TLS slot.
        • Using information from gdb on where pt_book is located, get the pthread_key for NSPR’s per-thread data.
        • Using the current task_struct from earlier, get the value of the GS segment register by looking into tls0_base and un-scrambling it from its hardware-specific configuration.
        • Use the pthread_key and GS to traverse the pthread structure and then the NSPR structure…
      • Find the last XPCJSContextInfo in the nsTArray in the XPCJSContextStack.
    • Pull the JSContext out, then get its JSStackFrame.
    • Recursively walk the frames (no iteration), manually/recursively (ugh) “converting” the 16-bit characters into 8-bit strings through violent truncation and dubious use of sprintf.

The obvious-ish limitation is that by relying on XPConnect’s understanding of the JS stack, we miss out on the most specific pure interpreter stack frames at any given time.  This is mitigated by the fact that XPConnect is like air to the Thunderbird code-base and that we still have the functions higher up the call stack.  This can also presumably be addressed by detecting when we are in the interpreter code and poking around.  It’s been a while since I’ve been in that part of SpiderMonkey’s guts… there may be complications with fast natives that could require clever stack work.

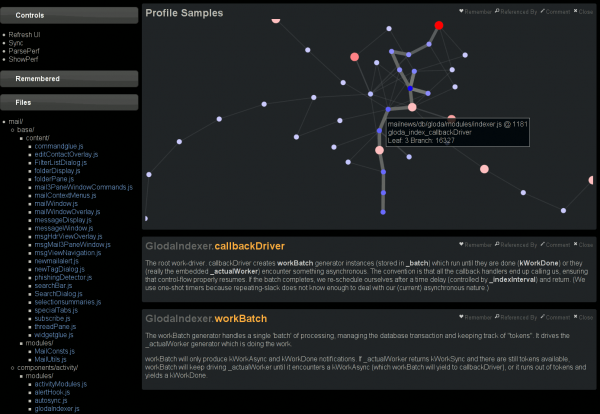
This blog post is getting rather long, so let’s just tie this off and say that I have extended doccelerator to be able to parse the trace files, spitting the output into its own CouchDB database.  Then doccelerator is able to expose that data via Kyle Scholz‘s JSViz in an interactive force-directed graph that is related back to the documentation data.  The second screenshot demonstrates that double-clicking on the (blue) node that is the source of the tooltip brings up our documentation on GlodaIndexer.callbackDriver.  doccelerator hg repovprobe emmett script in hg repo.

See a live demo here.  It will eat your cpu although it will eventually back off once it feels that layout has converged.  You should be able to drag nodes around.  You should also be able to double-click on nodes and have the documentation for that function be shown *if it is available*.  We have no mapping for native frames or XBL stuff at this time.  Depending on what other browsers do when they see JS 1.8 code, it may not work in non-Firefox browsers.  (If they ignore the 1.8 file, all should be well.)  I will ideally fix that soon by adding an explicit extension mechanism.

Better error reporting for the mozilla platform

old-and-busted-error-reporting

If you develop for the mozilla platform, you might be used to error messages like the above.  (Or you might wish you got error messages like the above…)  An uncaught javascript exception has resulted in a message in the error console as well as some equivalent stdout spew because it’s a debug build.  While any error is better than no error, it doesn’t exactly narrow down how we got there.

Wouldn’t it be nice if we got back-traces for these errors?

new-error-reporting-hotness

The future is now, people!  And it comes in the convenient form of a patch against the 1.9.1 branch, just like you always dreamed!  Also, an extension.

Currently (pre-patch), there are basically 3 ways scripting errors can show up in the platform:

  1. nsIScriptError instances.  These are what show up on the error console.  These have information equivalent to a single stack frame.
  2. nsIException instances.  These can provide a stack in the form of an nsIStackFrame chain (the same thing Components.stack gives you).  These get converted into nsIScriptError instances when it comes time to report them to the error console.  From a stack perspective, only XPConnect produces nsIException instances with stack traces, although you can make your own via Components.Exception.  A fundamental limitation of these stack traces is that they are only constructed from live JS call stacks, so if a JS exception has unwrapped its way to the top-level you are out of luck.
  3. JavaScript Error instances.  These have a private super-rich (it even knows arguments!) call-stack that can only be exposed as a string via the non-standard stack attribute.  XPConnect understands JS error reports (the ‘flat’ mechanism by which SpiderMonkey reports errors/exceptions to C++ code), but it has no clue about exceptions and their Error form of existence.  The exceptions in their error report guise are converted into nsIScriptError instances.

What the patch (on bug 493414) does is:

  • Introduce an nsIScriptErrorEx interface that extends nsIScriptError to provide a ‘location’ attribute like nsIException which is an nsIStackFrame.
  • Modify nsScriptError to implement the extended nsIScriptErrorEx.  Alternatively, I could have made XPConnect’s nsXPCException class implement nsIScriptError or nsScriptError also implement nsIException or something like that and not introduced nsIScriptErrorEx at all.
  • Modify all nsIScriptError-creation sites that I care about (I’m not looking at you, DOM workers) to try and provide or propagate existing nsIStackFrame information.
  • If a JS stack frame is not available, but an exception is in the form of a JS error, suck the call stack out of it.  Theoretically, this should not be a fallback but rather the default case, but it depends on some JS/XPConnect implementation details I am trying to avoid finding out about for now.
  • Modify the JS API to provide call stack sucking functionality.
  • Does various sketchy things to expose XPCJSStack::CreateStack from XPConnect to the error reporters in other modules.  If you thought the choice of creating nsIScriptErrorEx was sketchy, welcome to the Downtown East Side of dubious patches.  I expect there is no chance of it working on Windows because of this, and you may be out of luck on OS X.  Behold your comeuppance, popular platforms!

What the extension (repo) does is:

  • Add an nsIConsoleListener at app-startup that is aware of nsIScriptErrorEx and knows how to generate totally wicked 256-color ANSI escape sequences.
  • Not expose the stack traces in the error console.  The error console is for suckers who don’t have impossibly fast reflexes and a love of XON/XOFF flow control.
  • Only target Thunderbird.  Behold your comeuppance, all other mozilla applications!  (The extension wizard didn’t know how to do the thing that makes it work on all xulrunner-based things…  feel free to push a fixed install.rdf to my repo.)

I have logged bug 493414 to hold the patch and hopefully track the effort moving forward.

displaying execution traces on a SIMILE timeline

chronimoz-timeline-1

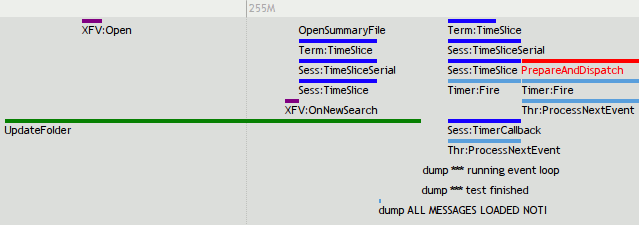
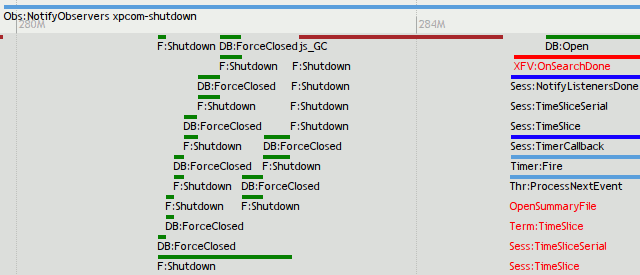
chroniquery can now output JSON for display using the SIMILE timeline widget.  And I am finally done trying to figure out what was going wrong.  Click the pictures to experience the timeline sensation for yourself.

Related interesting things:

  • Supports a fancy if specific constraint mechanism.  For example, PrepareAndDispatch is only displayed in the context of nsTimerImpl::Fire using the following line in the config file:
[func@PrepareAndDispatch]
only_show_if=backtrace,4,nsTimerImpl::Fire
  • Supports displaying arguments in the title using the config file.  For example, displaying the observer service’s topic (plus putting it in its own band and giving it a nice prefix):
[class@nsObserverService]
prefixAlias=Obs:
band=context
list_args=aTopic
  • We actually get the dump() output by logging where _IO_fputs shows up.  We constrain its output by adding an extensible (if currently somewhat specialized) argument-based constraint.
  • Things in red are red because their return codes were exceptional, per my last blog post.  Things in other colors are that way because of the config file.
  • The bubbles that show up when you click on things tell you the return value and arguments for the call in question.  We could include a backtrace, but they are expensive to compute (currently), so I don’t.
  • All layout is using the timeline widget’s layout.  There is no correspondence between stack depth and anything else.

chronimoz-timeline-2

An important limitation is that all functions displayed here were explicitly chosen for display.  Some form of automated mechanism could be used, but unless chronicle-query starts caching more things, it would be really slow.  Here’s the command-line used for the above:

chron-xpc mozrun-9022.db jsontrace -t 1 -f nsObserverService::NotifyObservers -f nsThread::ProcessNextEvent -f nsTimerImpl::Fire -f nsMsgSearchSession::NotifyListenersDone -f nsMsgDBFolder::Shutdown  -f nsMsgLocalMailFolder::AddMessage -f nsMsgDatabase::Open -f nsMsgDatabase::ForceClosed -f nsMsgLocalMailFolder::GetDatabaseWithReparse -f nsMsgDBFolder::OnAnnouncerGoingAway -f nsMsgDBFolder::AddSubfolder -f nsMsgSearchOfflineMail::OpenSummaryFile -f nsMsgSearchSession::TimerCallback -f nsMsgSearchSession::TimeSlice -f nsMsgSearchSession::TimeSliceSerial -f nsMsgSearchScopeTerm::TimeSlice -f nsMsgXFVirtualFolderDBView::Open -f nsMsgXFVirtualFolderDBView::OnNewSearch -f nsMsgXFVirtualFolderDBView::OnSearchDone  -f js_GC -f PrepareAndDispatch -f nsMsgLocalMailFolder::UpdateFolder -f _IO_fputs

understanding where unit tests go wrong with object diffs

chronimoz-diff-1

In our last chroniquery adventure, we used roc‘s chronicle-recorder to trace the execution of an xpcshell unit test and chroniquery (repo info) to use that trace to help us understand what was happening in some particularly confusing C-ish code.  Actually, we’re doing that this time too, but the bag of tricks now contains additional tricks.

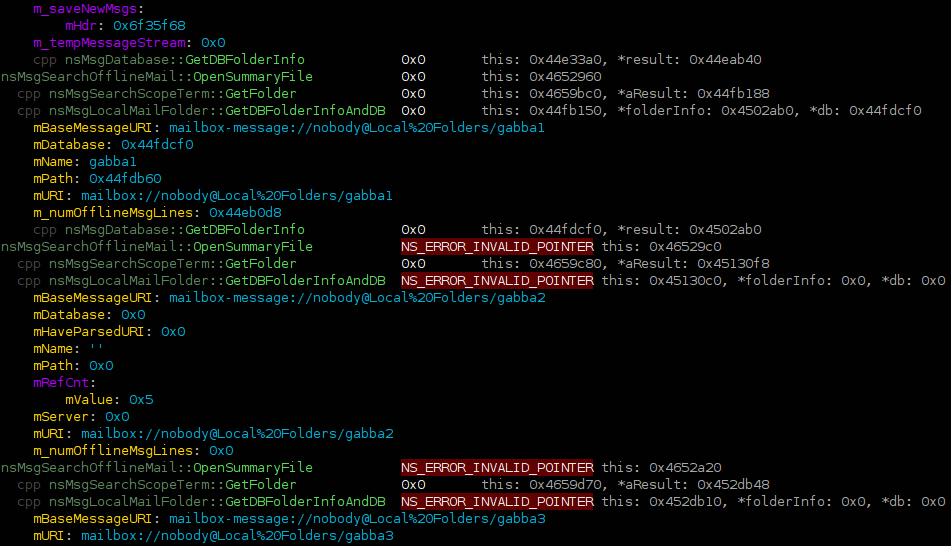
The exciting things happening in the screenshot above, in order of increasing awesomeness:

  • The argument list is exposing out-parameters (via a heuristic though, it doesn’t know the XPCOM details.)  ex: “*folderInfo: 0x0” used to be “folderInfo: some pointer to hold an out-parameter that leaves us none the wiser.”
  • Chronifer now sees through ‘this’-adjusting trampolines/wrappers.  Previously, function calls might be hidden because the stack pointer change that chronicle uses to determine function calls jumped to the trampoline whose bytecode was not associated with the actual function being called, and so would potentially be assumed to be boring.  The trampoline would modify rdi then perform a trivial jump (it could have just fallen through) into the function proper, which the existing trampoline detector would not notice.  (That detector only would notice an instant jump of more than 128 bytes; intended for dynamic linking indirection purposes.)
  • Pretty printers allow us to translate nsresult error codes to strings, display the strings referenced by nsString/nsCString instead of the raw structure (mData/mLength/mFlags), pierce nsCOMPtr’s, etc.
  • Pretty printers allow us to detect exceptional values and show them in red!  For example, that NS_ERROR_INVALID_POINTER is red because the nsresult pretty printer’s is_exceptional method returned True because the error bit was high.
  • The configuration method that lets us say what directories/files/classes/functions are interesting/boring has been augmented to let us specify arguments and the sub-fields of arguments to dump.  For example, in the above screenshot, we have added “dump_this=True” to the section labeled “[class@nsMsgLocalMailFolder]”.  As a result, any time a method is called on nsMsgLocalMailFolder, we dump the contents of its ‘this’.  If we only wanted a few fields from “this”, we could have used “dump_this=mPath,mIsServer,mName,mURI” instead.  You can see the end of a full object dump at the top of the screenshot.
  • The object dump output is diffed against the result of previous calls.  This is why we have that text in yellow.  The first entire GetDBFolderInfoAndDB call you see on the screen is a succesful call (no red!) diffed against a previous successful call.  Mainly we see the name-derived things changing and things we expect to be distinct (file path, database).  Then we have an error case, with a few things we probably would not have noticed if we were doing this by hand.  I was somewhat surprised that mHaveParsedURI, the reference count, and m_numOfflineMsgLines showed up.  The others are not entirely shocking, but it’s useful to have them all there.  Without the diff, we would be looking at 65 lines of attribute values, and that is with us already benefitting from the pretty printers.

Exciting possibilities opened by enhancements here:

  • The pretty printers and internal cleanups/refactoring make it feasible to express complicated data-based constraints simply.  For example, with a tractable amount of work I could opt to only see calls on the folder named “gabba3” using the constraint “mURI == ‘mailbox://nobody@Local%20Folders/gabba0′”.  This could be made particularly efficient if we make an assumption that the attribute is invariant once observed and then allow us to key off the pointer/memory region.
  • Code-sharing of pretty printers between my chroniquery code and my archer gdb plugins.
  • Now that archer-gdb has python inferior control, potential use of archer-gdb as an alternate back-end to chroniquery.
  • It would be neat to be able to expose chroniquery’s functionality via a web interface so that things could be expanded/drilled down without having to re-run things.  This would also help offset the non-trivial startup costs to chronicle-recorder’s own chronicle-query.  (Although arguably the startup time is nothing compared to the inefficiency of all the work chronicle-query does for a call and throws away when the next call pretty much wants that same data.)

gaudily syntax-highlighted code listings in (archer) gdb

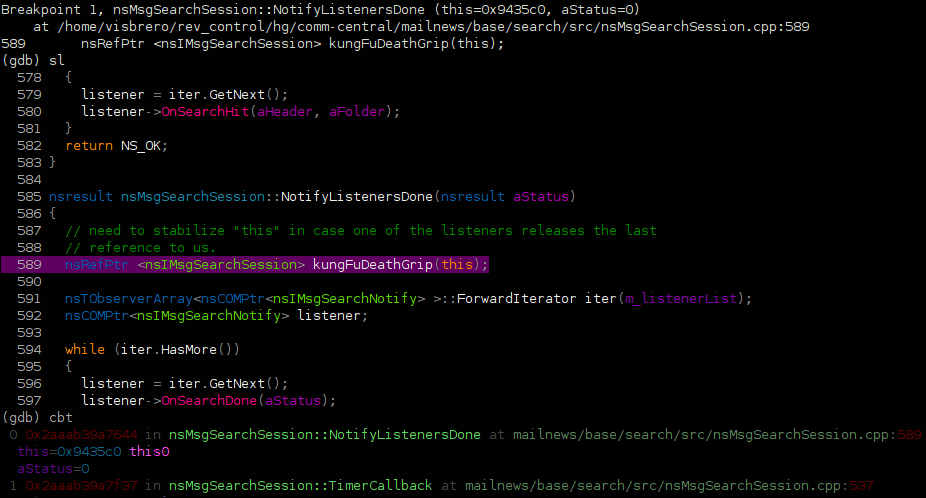
pyglist sl command output

Gaudily syntax-highlighted code listing in gdb joins the gaudy gdb plugin family!  (Other members include gaudily colorized backtraces, which you can also see in the bottom of the screenshot.)  This, of course, requires gdb with python crammed inside.  It might require one crammed a few months ago too; I haven’t updated my archer-gdb repo for at least that long.

The “sl” plugin uses Pygments for the syntax highlighting.  Although pygments has a 256 color terminal formatter (woo!), I ended up using my pyflam module because it did not support my need to color the background of the current line without doing something convoluted.  (I would have had to create a filter that did its own line-counting and created background-color-styled token variant of every token on the desired line.)  Also, it didn’t do line numbers.

The color theme is based off the “fruity” color theme.  Much of the gaudy comes from a filter I added that tries to do various Mozilla C++-aware code styling things by recognizing naming patterns of Name tokens.  Before you complain about the colors hurting your brain, remember that this is the alternative:

not-pyglist, standard list command

That’s right.  It’s like looking at static.  You can barely make anything out.  And imagine if it was more than just the 10 lines “list” gives you.

Anywho, the repo is here: http://hg.mozilla.org/users/bugmail_asutherland.org/pythongdb-gaudy/

The README tells you what to do.  For complete-ness, and because I went to all the effort to write documentation for the command, here is what it does!

Prints a syntax-highlighted source listing.  Currently limited to only
work based on the current debug frame and position.

By default, the 11 lines before the current position and 8 lines after are
displayed.  A line context is saved between command invocations if the current
source line does not change.

Arguments when used in a new context:
  (none)  Shows the 11 lines before the current position and 8 lines after.
  N       Shows the N/2 lines befores the current position and N/2 lines after.
  -N      Shows the N lines before the current position and 8 lines after.
  +N      Shows the 11 lines before the current position and N lines after.
  M N     Shows the M lines before the current position and N lines after.

Arguments in an existing context:
  (none)  Shows the 20 lines after the last-shown lines.
  -       Shows the 20 lines preceding the last-shown lines.
  N       Shows the N lines after the last-shown lines.
  -N      Shows the N lines preceding the last-shown lines.
  M N     Shows the M last lines of the last-shown lines and N lines after the
            last-shown lines.

Arguments regardless of context
  @A,B    Shows lines A through B.