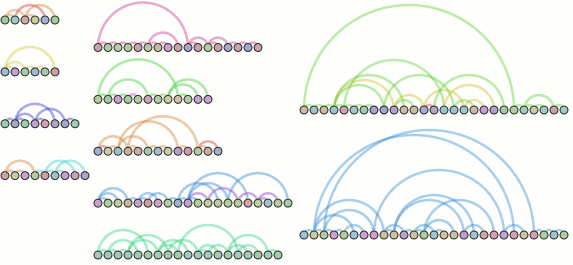
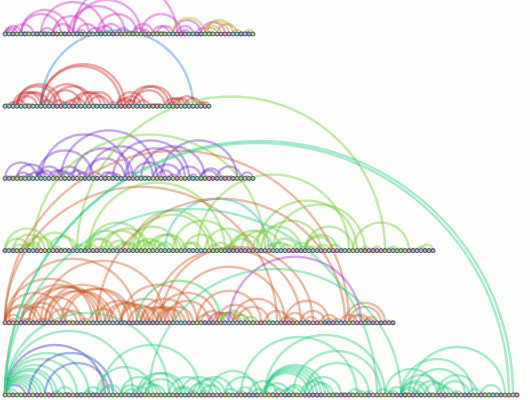
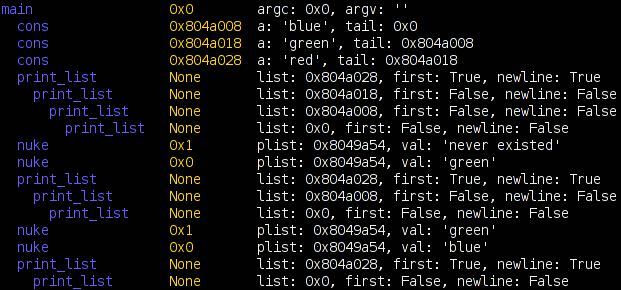
Thanks to new and improved time management skills (and a holiday weekend doesn’t hurt), I’ve got a chronicle-recorder visualization going on via chroniquery:
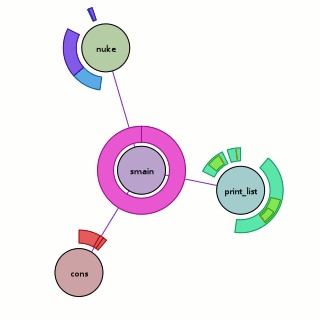
Above, we have the visualization run against the ‘fancy’ program seen in the previous chroniquery posts (with one caveat, addressed later). What does it mean?
- The circular nodes are functions in the executed program. In this case, we start from ‘smain’ and pull in all the subroutines that we detect.
- The edges between nodes indicate that a function call occurred between the two functions sometime during the execution; it could be once, it could be many times. The color of the edge is a slightly more saturated version of the color of the node that performed the call. If they call each other, only one color wins.
- The rings around the outside of each node indicate when it was called, specifically:
- The ring starts and stops based on the chronicle-query timestamp. Like on a clock, time starts at due north and flows around clock-wise, with the last smidge of time just before we reach due north again. This has its ups and downs. The reason we are using ‘smain’ instead of ‘main’ is that when we used the untouched main, the first “new” ended up taking up most of our timestamp space. So I turned main into smain and had a new main that takes the memory allocator start-up cost hit and then calls smain.
- The thickness of the ring indicates the depth of the call-stack at the time. The thickest ring corresponds to the outermost function, the thinnest ring to the innermost function. This results in a nice nesting effect for recursive functions, even if it’s more of an ‘indirect’ recursion.
- The color of each ring slice is based on the control flow taken during the function call. (I think this is awesome, hence the bolding.) Now, I’m making it sound fancier than it is; as a hackish first pass, we simply determine the coverage of all the instructions executed during that function call. A more clever implementation might do something when iteration is detected. A better implementation would probably move the analysis into the chronicle-query core where information on the basic blocks under execution should be available. Specific examples you can look at above:
- print_list: The outermost calls are aqua-green because their boolean arguments are true. The ‘middle’ calls are light green because their boolean arguments are false. The fina, innermost calls are orange-ish because they are the terminal case of the linked-list traversal where we realize we have a NULL pointer and should bail without calling printf. They are also really tiny because no printf means basically no timestamps for the function.
- nuke: Four calls are made to nuke; the first and third times (light blue) we are asking to remove something that is not there, the second and fourth times (purple) we are asking to remove something that is. I have no idea why the third removal is so tiny; either I have a bug somewhere or using the timestamps is far more foolish than I thought.
Besides the obvious shout-out to chronicle-recorder, pygraphviz and graphviz power the graph layout. Now, a good question would be whether this actually works on something more complex? Could it be? Well, you can probably see the next picture as you’re reading this, so we’ll cut this rhetorical parade short.
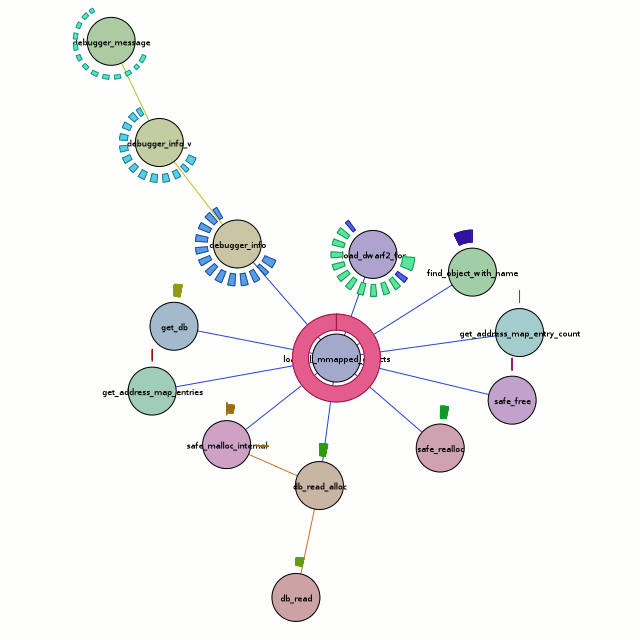
Besides the obvious font issues, this actually looks pretty nice. But what does it tell us? Honestly, the full traversal here is excessive. All we care about is the center node, load_all_mmapped_objects, and load_dwarf2_for (due north and a teeny bit east of the center node). If we look at the calls to load_dwarf2_for, we can see that two of them have different control-flow coverages. Those happen to be the times debug symbols could not be found (which is my problem I want to debug). The first one is for ld-2.6.1.so (I’m looking at the textual output of chronisole for the same command), and the second one is for /usr/bin/python2.5. The second one should definitely not fail, because it should find the symbols in /usr/lib/debug, but it does.
Unfortunately, the trail sorta stops cold there with a bug in either chronicle-query or in chroniquery (possibly cribbed from chronomancer). load_dwarf2_for should be calling dwarf2_load, but we don’t see it. I don’t know why, but I haven’t actually looked into it either. Rest assured that a much more awesome graph awaits me in the future!
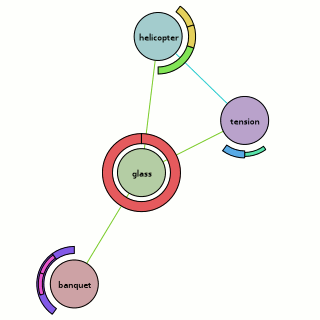
Because there’s too much text and not enough pictures, I’ll also throw in the output of the ring visualization test which uses a stepped tick-count (1 per function call) to show how things could look if we went with an artificial time base…
Bzr repositories for both can be found at http://www.visophyte.org/rev_control/bzr/.
