It’s a story as old as time itself. You write a unit test. It works for you. But the evil spirits in the tinderboxes cause the test to fail. The trick is knowing that evil spirits are a lot like genies. When you ask for a wish, genies will try and screw you over by choosing ridiculous values wherever you forgot to constrain things. For example, I got my dream job, but now I live in Canada. The tinderbox evil spirits do the same thing, but usually by causing pathological thread scheduling.
This happened to me the other day and a number of our other tests are running slower than they should, so I decided it was time for another round of incremental amortized tool-building. Building on my previous systemtap applied to mozilla adventures by porting things to the new JS representations in mozilla-2.0 and adding some new trace events I can now generate traces that:
- Know when the event loop is processing an event. Because we reconstruct a nested tree from our trace information and we have a number of other probes, we can also attribute the event to higher-level concepts like timer callbacks.
- Know when a new runnable is scheduled for execution on a thread or a new timer firing is scheduled, etc. To help understand why this happened we emit a JS backtrace at that point. (We could also get a native backtrace cheaply, or even a unified backtrace with some legwork.)
- Know when high-level events occur during the execution of the unit test. We hook the dump() implementations in the relevant contexts (xpcshell, JS components/modules, sandboxes) and then we can listen in on all the juicy secrets the test framework shouts into the wind. What is notable about this choice of probe point is that it:
- is low frequency, at least if you are reasonably sane about your output.
- provides a useful correlation between what it is going on under the hood with something that makes sense to the developer.
- does not cause the JS engine to need to avoid tracing or start logging everything that ever happens.
Because we know when the runnables are created (including what runnable they live inside of) and when they run, we are able to build what I call a causality graph because it sounds cool. Right now this takes the form of a hierarchical graph. Branches form when a runnable (or the top-level) schedules more than one runnable during the execution of a single runnable. The dream is to semi-automatically (heuristics / human annotations may be required) transform the hierarchical graph into one that merges these branches back into a single branch when appropriate. Collapsing linear runs into a single graph node is also desired, but easy. Such fanciness may not actually be required to fix test non-determinism, of course.
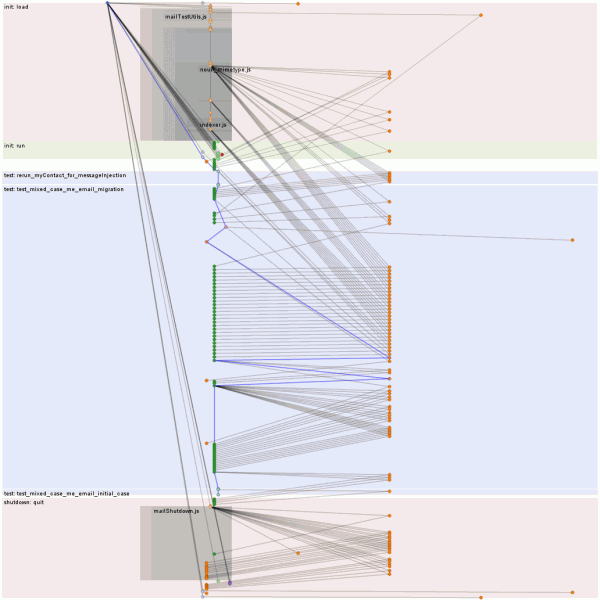
The protovis-based visualization above has the following exciting bullet points describing it:
- Time flows vertically downwards. Time in this case is defined by a globally sequential counter incremented for each trace event. Time used to be the number of nanoseconds since the start of the run, but there seemed to somehow be clock skew between my various processor cores that live in a single chip.
- Horizontally, threads are spaced out and within those threads the type of events are spaced out.
- The weird nested alpha grey levels convey nesting of JS_ExecuteScript calls which indicates both xpcshell file loads and JS component/module top-level executions as a result of initial import. If there is enough vertical space, labels are shown, otherwise they are collapsed.
- Those sweet horizontal bands convey the various phases of operation and have helpful labels.
- The nodes are either events caused by top-level runnable being executed by the event loop or important events that merit the creation of synthetic nodes in the causal graph. For example, we promote the execution of a JS file to its own link so we can more clearly see when a file caused something to happen. Likewise, we generate new links when analysis of dump() output tells us a test started or stopped.
- The blue edges are expressing the primary causal chain as determined by the dump() analysis logic. If you are telling us a test started/ended, it only follows that you are on the primary causal chain.
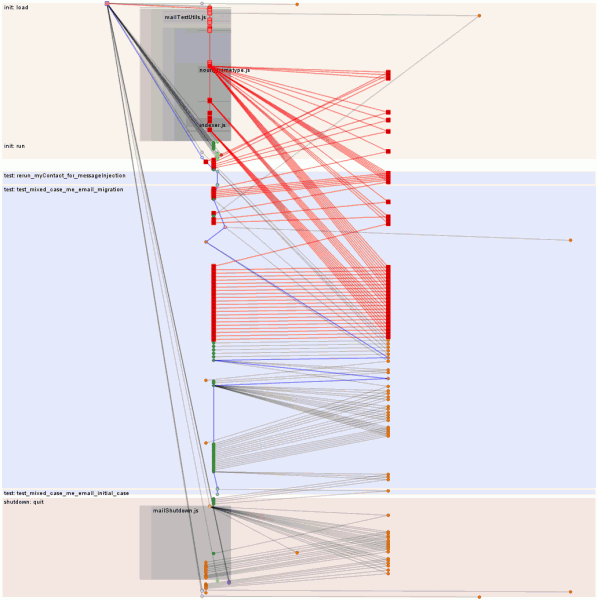
- If you were viewing it in a web browser, you could click on the nodes and it would console.log them and then you could see what is actually happening in there. If you hovered over nodes they would also highlight their ancestors and descendents in various loud shades of red.
- The specific execution being visualized had a lot of asynchronous mozStorage stuff going on. (The right busy thread is the asynchronous thread for the database.) The second image has the main init chain hovered, resulting in all the async fallout from the initialization process being highlighted in red. At first glance it’s rather concerning that the initialization process is still going on inside the first real test. Thanks to the strict ordering of event queues, we can see that everything that happens on the primary causal chain after it hops over to the async thread and back is safe because of that ordering. The question is whether bad things could happen prior to that joining. The answer? In another blog post, I fear.
- Or “probably”, given that the test has a known potential intermittent failure. (The test is in dangerous waters because it is re-triggering synchronous database code that normally is only invoked during the startup phase before references are available to the code and before any asynchronous dispatches occur. All the other tests in the directory are able to play by the rules and so all of their logic should be well-ordered, although we might still expect the initialization logic to likewise complete in what is technically a test phase. Since the goal is just to make tests deterministic (as long as we do not sacrifice realism), the simplest solution may just be to force the init phase to complete before allowing the tests to start. The gloda support logic already has an unused hook capable of accomplishing this that I may have forgotten to hook up…
Repo is my usual systemtapping repo. Things you might type if you wanted to use the tools follow:
- make SOLO_FILE=test_name.js EXTRA_TEST_ARGS=”–debugger /path/to/tb-test-help/systemtap/chewchewwoowoo.py –debugger-args ‘/path/to/tb-test-help/systemtap/mozperfish/mozperfish.stp –‘” check-one
- python /path/to/tb-test-help/chewchewwoowoo.py –re-run=/tmp/chewtap-##### mozperfish/mozperfish.stp /path/to/mozilla/dist/bin/xpcshell
The two major gotchas to be aware of are that you need to: a) make your xpcshell build with jemalloc since I left some jemalloc specific memory probes in there, and b) you may need to run the first command several times because systemtap has some seriously non-deterministic dwarf logic going on right now where it claims that it doesn’t believe that certain types are actually unions/structs/whatnot.


“systemtap has some seriously non-deterministic dwarf logic going on right now where it claims that it doesn’t believe that certain types are actually unions/structs/whatnot.”
Andrew, we’d appreciate a (reminder ?) bug report about this. I swear we don’t have a random number generator in there – at least not for this.
Hi – I’m a systemtap author, and I really enjoy seeing use-cases like this. It may take me a bit to grok your script, as its more complex than most we see, but I’d like to make sure that we don’t drop the ball on the issues you had with systemtap itself. I found two things in mozperfish.stp comments:
– Incorrect “flags” resolution in JSFunction inherited from JSObject. I’ve suspected before that our algorithm may be too greedy, but you’re the first I know who’s run into trouble with it. We should be able to get this right.
– A commented-out block containing a “dwarf probabilistic nightmare” — what does this mean? I assume this is the same determinism problem mentioned at the end of this blog post, but stap’s compilation should be entirely consistent.
Anything else? I’ll check back in these comments later, or you’re welcome send problem details to the systemtap mailing list or freenode #systemtap. Thanks!
First, my apologies if I came off a bit complainy. Systemtap is a phenomenally awesome tool. And I say that having extensively used and investigated DTrace, VProbes, and Xperf, all of which are good tools for the purposes for which they were intended. The power of the systemtap language and ability to write native code allows me to do things that were completely impossible in DTrace. The built-in dwarf probe magic allows the scripts to look reasonable and be powerful; with VProbes I needed to use a combination of gdb and laborious manual coding to extract information from data structures. (Although I may have automated some of that before I abandoned VProbes.)
Thanks for directly reaching out! I’ve been putting off filing a bug just because of concerns of ease of reproduction or analysis of the problem. We’ve recently made changes where basically all of our libraries now get linked into a single super-library, libxul.so. On my system, libxul.so is 280M and much of that is debug info. I tried to pipe a full dwarfdump of the library to less and search for the records that might be confusing it; I gave up after the less process got up to a few gigs of memory. I would call that a torture test for any dwarf logic, especially given that I think even gdb had trouble with some of the mozilla libraries and partial types at one point.
I’m on Fedora Core 13 with updates enabled. I think my Systemtap is sufficiently up-to-date (1.3 and the git repo doesn’t seem to have much in the way of dwarf changes since the release); I’m unclear if my gcc is the latest and greatest (4.4.4 2010630 Red Hat 4.4.4-10).
The “dwarf probabilistic nightmare” was indeed the same thing. With that block uncommented it would take something like 7 runs for the stars to align and the full compilation pass to succeed. With it commented out, and I think with a few changes made for other reasons it succeeds on the first try more than 50% of the time now.
My complaint about JSFunction and JSObject both defining flags was not actually a systemtap complaint… it just seems like a bad idea for the classes in the first place, although it would indeed be nice for systemtap to be able to detect/disambiguate or do the spec thing and choose the most specific.
Andrew, could you share that monster libxul.so file? (Or at least build instructions for it?)
You should take a look at some of the work presented at OSDI 2010, on deterministic execution and replay, particularly at the Linux system call level. One project, for instance, allowed creating a fully deterministic container for Linux processes, even making IPC deterministic.
I’m moving follow-up to sourceware bugzilla bug since my blog comments is an inconvenient place for people who aren’t me. (I get e-mail updates! woo!)
http://sourceware.org/bugzilla/show_bug.cgi?id=12121
Pingback: visophyte: shiny? shiny. : fighting oranges with systemtap probes, latency fighting; step 2