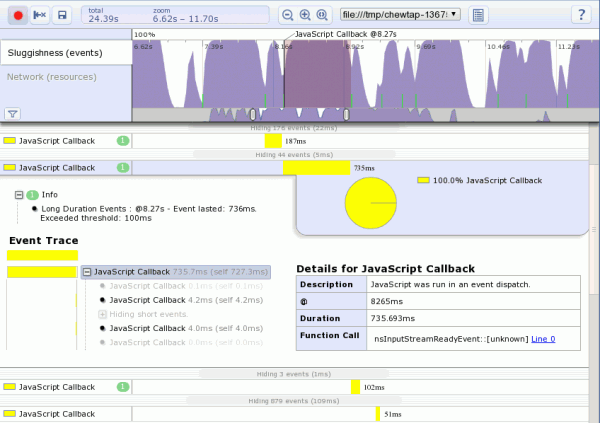
Now that Thunderbird 3.1 is string/feature-frozen it’s time to focus on performance. This post is just to make sure that people who are also working on similar things know what I’m up to. For example, there’s some very exciting work going on involving adding a startup timeline to mozilla-central that everyone keeping up-to-date with mozilla performance work should be aware of. In summary, no results yet, but soon!
The big bullet points for now are:
- GWT SpeedTracer is a very impressive tool.
- I have seriously cleaned up / automated my previous SystemTap script work for mozilla. Invoking python chewchewwoowoo.py speedtracer/mozspeedtrace.stp `pgrep thunderbird-bin` does the following:
- generates a version of the source script with any line statements fixed up based on one or more line seeks in a file.
- builds the command line and invokes the system tap script.
- invokes a post-processing script specified in the tap file, feeding it address-translation helpers and systemtap bulk logging per-cpu fusion.
- mozspeedtrace.stp and its post-processor produce an HTML file with embedded JSON that the SpeedTracer Chrome extension recognizes as one of its own. (SpeedTracer runs in Firefox through the GWT development mode, but being very new to GWT I am not yet clear on if/how to be able to wrap it up to be used as a webapp from static data.)
- My mapping of events as recorded by my SystemTap probes to SpeedTracer events is somewhat sketchy, but part of that is due to the limited set of events and their preconfigured display output. (I believe it turns out I can generate optional data like fake stack traces to be able to expand the set of mapped events without having to modify SpeedTracer.) This is way basically everything in the screenshot is a yellow ‘JavaScript Callback’.
- I have not implemented probes for all of the event types defined by SpeedTracer, I have not ported all of my previous probes yet, and there are still some new probes yet to add. Happily, most of the hard work is already in the can.
- The motivation behind this is very different from the startup timeline. Thunderbird uses mozilla-1.9.2, not mozilla-central, and my primary investigatory focus is memory usage in steady-state after start-up, not the time it takes to start up. (We do, of course, want to improve performance where possible.) It just so happens that in order to usefully explain who is allocating memory we also have to know who is active at the time / why they are active, and that provides us with the performance timeline data.
- This work is not likely to be useful for per-tab/webpage performance data gathering… just whole-program performance investigation like Thunderbird needs.
- This is a work-in-progress, but the focus is on improving Thunderbird’s performance issues, not building tooling. As such, I may have to bail on SpeedTracer in favor of command-line heuristic analysis if I can’t readily modify SpeedTracer to suit my needs. I picked SpeedTracer partially to (briefly) investigate GWT, but from my exploration of the code thus far, the activation energy required may be too great.

