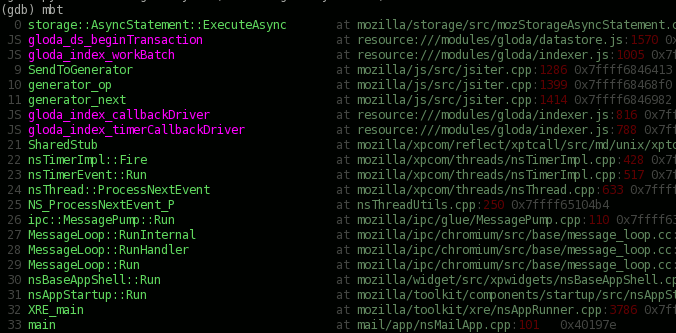
unified JS/C++ backtraces, colorized backtraces, colorized source listing for gdb 7.3/archer-trunk updated

type "mbt", see this.

gdb has had integrated python support for some time and it is truly awesome.  The innards have changed here and there, so my previous efforts to show colorized/fancy backtraces, show colorized source listings, and provide unified JS/C++ mozilla backtraces (with colors still) have experienced some bit-rot over time.
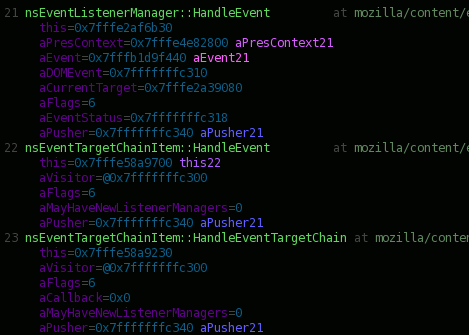
type "cbt", see this

I have de-bitrotted the changes, hard.  Hard in this case means that the changes depend on gdb 7.3 which only exists in the future or in the archer repo you can find on this wiki page, or maybe in gdb upstream but I already had the archer repo checked out…
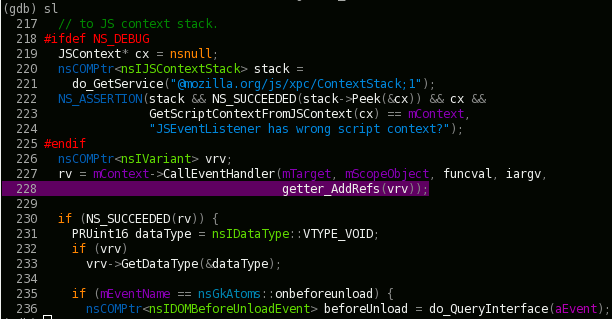
type "sl", see this.

In any event, if you like gdb and work with mozilla, you will not only want these things, but also Jim Blandy’s mozilla-archer repo which has magic SpiderMonkey JS helpers (one of which mozbt depends on; those JSStrings are crazy, yo!).  Coincidentally, he also depends on the future, and his README tells you how to check out the archer branch in greater detail.

You can get your own copy of these very exciting gdb python things from my github pythongdb-gaudy repo.

The important notes for the unified backtrace are:

  • It does’t work with the tracing JIT; the trace JIT doesn’t produce the required frames during its normal operation.
  • It might work with the method JIT if gdb could unwind method JIT frames, but it doesn’t seem to do that yet.  (Or I didn’t build with the right flag to tell it to use a frame pointer/etc., or I am using the wrong gdb branch/etc.)  Once the Method JIT starts telling gdb about its generated code with debug symbols and the performance issues in gdb’s JIT interface are dealt with, you can just use the colorizing backtrace because no special logic is required to interleave frames at that point and Jim Blandy’s magic JS pretty printers should ‘just work’.
  • Don’t forget that if you just want a pure JS backtrace (and with all kinds of fanciness) and have a debug build, you can just do “call DumpJSStack()” in gdb and it will call back into XPConnect and invoke the C++ code that authoritatively knows how to walk this stuff.
  • If you’re cool and using generators, then you’re stuck with the interpreter, so it will totally work.

gaudily syntax-highlighted code listings in (archer) gdb

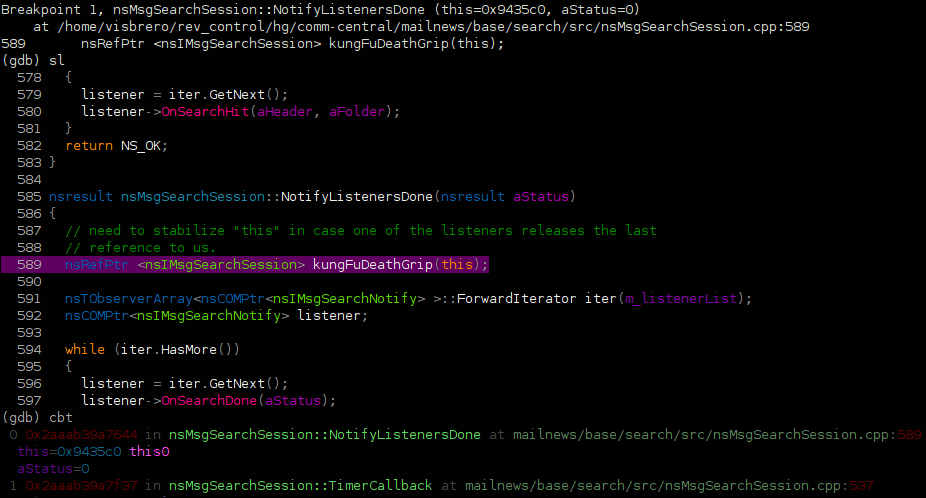
pyglist sl command output

Gaudily syntax-highlighted code listing in gdb joins the gaudy gdb plugin family!  (Other members include gaudily colorized backtraces, which you can also see in the bottom of the screenshot.)  This, of course, requires gdb with python crammed inside.  It might require one crammed a few months ago too; I haven’t updated my archer-gdb repo for at least that long.

The “sl” plugin uses Pygments for the syntax highlighting.  Although pygments has a 256 color terminal formatter (woo!), I ended up using my pyflam module because it did not support my need to color the background of the current line without doing something convoluted.  (I would have had to create a filter that did its own line-counting and created background-color-styled token variant of every token on the desired line.)  Also, it didn’t do line numbers.

The color theme is based off the “fruity” color theme.  Much of the gaudy comes from a filter I added that tries to do various Mozilla C++-aware code styling things by recognizing naming patterns of Name tokens.  Before you complain about the colors hurting your brain, remember that this is the alternative:

not-pyglist, standard list command

That’s right.  It’s like looking at static.  You can barely make anything out.  And imagine if it was more than just the 10 lines “list” gives you.

Anywho, the repo is here: http://hg.mozilla.org/users/bugmail_asutherland.org/pythongdb-gaudy/

The README tells you what to do.  For complete-ness, and because I went to all the effort to write documentation for the command, here is what it does!

Prints a syntax-highlighted source listing.  Currently limited to only
work based on the current debug frame and position.

By default, the 11 lines before the current position and 8 lines after are
displayed.  A line context is saved between command invocations if the current
source line does not change.

Arguments when used in a new context:
  (none)  Shows the 11 lines before the current position and 8 lines after.
  N       Shows the N/2 lines befores the current position and N/2 lines after.
  -N      Shows the N lines before the current position and 8 lines after.
  +N      Shows the 11 lines before the current position and N lines after.
  M N     Shows the M lines before the current position and N lines after.

Arguments in an existing context:
  (none)  Shows the 20 lines after the last-shown lines.
  -       Shows the 20 lines preceding the last-shown lines.
  N       Shows the N lines after the last-shown lines.
  -N      Shows the N lines preceding the last-shown lines.
  M N     Shows the M last lines of the last-shown lines and N lines after the
            last-shown lines.

Arguments regardless of context
  @A,B    Shows lines A through B.

gaudily colorized gdb backtraces! woo!

pythongdb-gaudy-groupview-crash-1

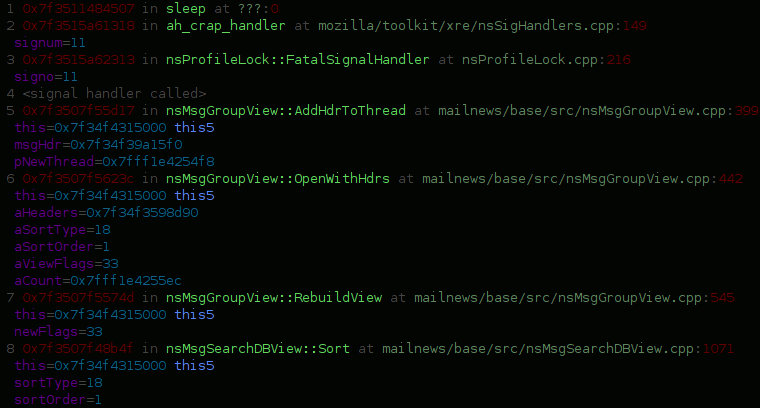
Like many people who have overdosed on syntax highlighting and other forms of colorization, my brain is no longer able to process monochrome text displays.  Which is why I have been so excited about gdb with python crammed inside.  (The good sense of “crammed”, wherein one is cramming cookies in one’s mouth.)  I have perverted its spirit and used it to colorize gdb backtraces!  Woo!

While I was in there, I have done two useful things:

  • There is magic of limited potency that normalizes the path automatically.
  • It looks at all the values in the arguments (and locals too, I guess) and if they are used more than once, it considers making them “interesting”.  Interesting values get named based on where we first saw them, and assigned a color.  Then, whenever they appear in the backtrace, they get their special name and color to help us see the flow of values through the backtrace.  For example, in the screenshot above you can see “this5” in a nice* blue color.  Each time its value appears, the “this5” label appears (the 5 is for frame 5).  I find this easier than manually scanning using my brain.

My hg repo is here: http://hg.mozilla.org/users/bugmail_asutherland.org/pythongdb-gaudy/

If you like this, or if you don’t like this but do like useful things, you are even more likely to like Jim Blandy’s archer-mozilla repo which is full of magic debugging help for spidermonkey in gdb.  (nb: The python-gdb trunk right now has changed how pretty printers register, and I don’t think that repo has yet caught up.)  Also, see Tom Tromey’s blog posts about the whole python-gdb thing.

* When I use “nice” in terms of colors, this is from my perspective as someone who demands many colors, has the time to add crazy colors to everything, but inexplicably does not have the time to actually pick colors that humans find appealing (or even non-nauseating).  I am going to pass the buck to the people who originally conceived of 256-color xterms and thought I could be trusted with a color cube, no matter how limited.

Pretty Polish

pretty-pretty.png

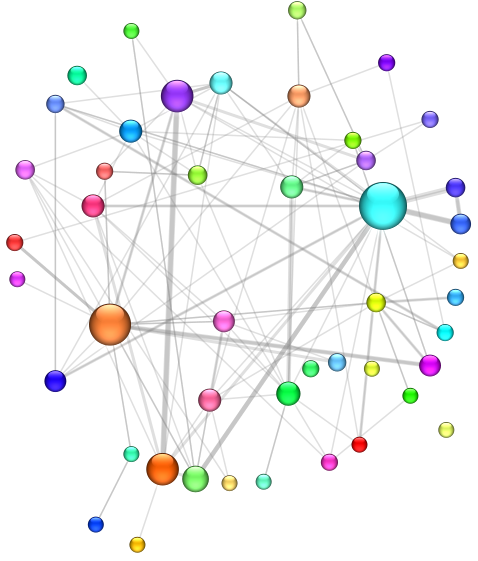
As part of a continuing effort to make visophyte’s byproducts look attractive, I implemented a bit more shiny today. Using this aqua sphere effect photoshop tutorial at skdstudio.com as a basis, I have made the simple circle renderer support a ‘pretty’ option.

Unfortunately, this took a lot longer than I was hoping. Cairo lacks a Gaussian blur mechanism, PIL only supports 5×5 image kernels (iterative application is too slow), and using SciPy was absurdly slow and didn’t even work right before I gave up on it. Thankfully, in my googling it turned out that box blurs can be used to approximate a Gaussian blur. So visophyte’s cairo renderer now has a home-grown “box blur” filter using a boxcar average to keep the iterations and redundant calculations down.  (And only using the array module, so no new dependencies.)

mailman-pretty-circles.png

The latter vis is just the same vis as in my post about pretty pie charts, but with the pie visualizations replaced with circles. A net loss in information, but perhaps a net gain in prettiness? (Utility probably stays about the same…)

Cairo bakes Pretty Pies

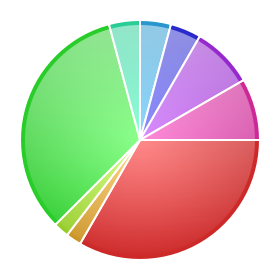
Vacation found me actually relaxing, but some pretty progress has been had. I forgot to push my 64-bit aggdraw patches to the laptop I brought, so I implemented a cairo renderer. This has resulted in some backend cleanup and refactoring, although there is more to do. This also allows for attractive use of gradients:

pretty-pie.png

The changes to the pie-chart rendering are based on an Illustrator tutorial on how to make pretty pie charts. Although the pie chart has long known how to label itself and is now more competent at it, labels still overlap so they have been mercilessly disabled in this picture.

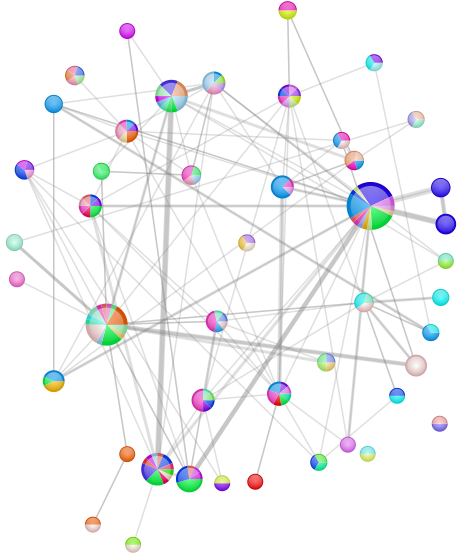
pretty-graphito-pies-python-dev-2007-july-twopi-fancy.png

This is a graph of the python-dev traffic (from the mailman archive) for July 2007 once more. This time:

  • The nodes are authors.
    • The radius of the node is a linear mapping lower bounded at 8 and upper-bounded at 24 based on the number of messages the author wrote during the time period.
    • The pie slices are the threads the author replied to/started during the month.
      • Their weights are the number of messages they wrote involved in that thread.
      • Their colors are distinctly colored. Because the previous distinct color mechanism clearly fell down by providing colors which were too similar, I did a first pass at varying the saturation in addition to varying the hue. Varying value/brightness seemed a little too distracting, but it might be okay with less severe variations.
  • The edges indicate that the author replied to a message by another author.
    • The width is (linearly) based on the number of times the user replied to the other author.
    • The color is always 25% opaque 50%-gray. Since the edges are effectively directed (but not visually distinguished), a case in which two authors replied to each other will result in a darker gray, at least in the region of overlap (since width can vary).
  • The layout is graphviz‘s twopi.