In our last logging adventure, we hooked Log4Moz up to Chainsaw. As great as Chainsaw is, it did not meet all of my needs, least of all easy redistribution. So I present another project in a long line of fantastically named projects… LogSploder!
The general setup is this:
- log4moz with a concept of “contexts”, a change in logging function argument expectations (think FireBug’s console.log), a JSON formatter that knows to send the contexts over the wire as JSON rather than stringifying them, plus our SocketAppender from the ChainSaw fun. The JSONed messages representations get sent to…
- LogSploder (a XULRunner app) listening on localhost. It currently is context-centric, binning all log messages based on their context. The contexts (and their state transitions) are tracked and visualized (using the still-quite-hacky visophyte-js). Clicking on a context displays the list of log messages associated with that context and their timestamps. We really should also display any other metadata hiding in the context, but we don’t. (Although the visualization does grab stuff out of there for the dubious coloring choices.)
So, why, and what are we looking at?
When developing/using Thunderbird’s exciting new prototype message/contact/etc views, it became obvious that performance was not all that it could be. As we all know, the proper way to optimize performance is to figure out what’s taking up the most time. And the proper way to figure that out is to write a new tool from near-scratch. We are interested in both comprehension of what is actually happening as well as a mechanism for performance tracking.
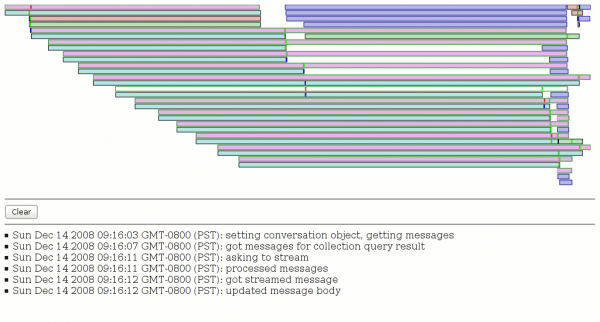
The screenshot above shows the result of issuing a gloda query with a constraint of one of my Inbox folders with a fulltext search for “gloda” *before any optimization*. (We already have multiple optimizations in place!) The pinkish fill with greenish borders are our XBL result bindings, the blue-ish fill with more obviously blue borders are message streaming requests, and everything else (with a grey border and varying colors) is a gloda database query. The white bar in the middle of the display is a XBL context I hovered over and clicked on.
The brighter colored vertical bars inside the rectangles are markers for state changes in the context. The bright red markers are the most significant, they are state changes we logged before large blocks of code in the XBL that we presumed might be expensive. And boy howdy, do they look expensive! The first/top XBL bar (which ends up creating a whole bunch of other XBL bindings which result in lots of gloda queries) ties up the event thread for several seconds (from the red-bar to the end of the box). The one I hovered over likewise ties things up from its red bar until the green bar several seconds later.
Now, I should point out that the heavy lifting of the database queries actually happens on a background thread, and without instrumentation of that mechanism, it’s hard for us to know when they are active or actually complete. (We can only see the results when the main thread’s event queue is draining, and only remotely accurately when it’s not backlogged.) But just from the visualization we can see that at the very least the first XBL dude is not being efficient with its queries. The second expensive one (the hovered one) appears to chewing up processor cycles without much help from background processes. (There is one recent gloda query, but we know it to be cheap. The message stream requests may have some impact since mailnews’ IMAP code is multi-threaded, although they really only should be happening on the main thread (might not be, though!). Since the query was against one folder, we know that there is no mailbox reparse happening.)
Er, so, I doubt anyone actually cares about what was inefficient, so I’ll stop now. My point is mainly that even with the incredibly ugly visualization and what not, this tool is already quite useful. It’s hard to tell that just from a screenshot, since a lot of the power is being able to click on a bar and see the log messages from that context. There’s obviously a lot to do. Probably one of the lower-hanging pieces of fruit is to display context causality and/or ownership. Unfortunately this requires explicit state passing or use of a shared execution mechanism; the trick of using thread-locals that log4j gets to use for its nested diagnostic contexts is simply not an option for us.


