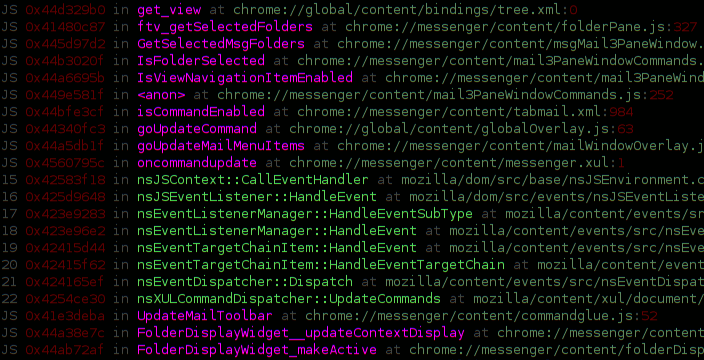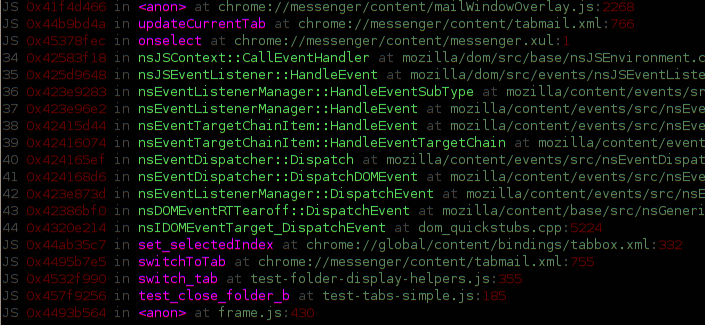
As far as I know (and ignoring my previous efforts on chroniquery along these lines), up until now you had your C/C++ Mozilla backtraces via gdb (chocolate) and your JS backtraces via “call DumpJSStack()” or the debugger keyword from within JS (peanut butter), but these two great flavors had never come together to make a lot of money for dentists.
The screenshots (which is actually just one screenshot split in two) show invocation of a custom python gdb command building on my previous exciting pretty gdb commands. The command has filtered out boring JS interpreter / XPConnect code and interleaved exciting interesting JS stack frames.
The implementation is reasonably simple and intended to be able to be implemented using VProbes to support my recent performance work along those lines. We walk stack frames the usual way. Ahead of time, we have marked out the PC ranges of interesting JS interpreter functions (js_Interpret and js_Execute). If the stack frame’s instruction pointer is in one of those functions we grab the JSContext argument. We pop frames until we reach the native frame those functions allocate from their own stack space (whose boundaries we know from the stack walking).
There is one trick we have to do involving dormantFrameChain. While js_Execute has a consistent and straightforward usage of JS_SaveFrameChain, XPConnect and its quickstub friends are more complex. Right now we use a dumb heuristic that just looks if our frame pointer is 0 and there is a dormantFrameChain, and in that case we restore it. (Thankfully the garbage collector needs to know about the shelved frames, otherwise we might have to chase frames down.) I haven’t put much effort into thinking about it, but the heurstic seems a bit reckless. We could likely just concurrently walk the XPConnect context stack to figure out when to restore dormant frame chains. The existing VProbe JS stack (only) code already goes to the horrible effort to get at the thread-local stack, so it wouldn’t be too much more work. Things probably also fall down during garbage collection right now.
Hg repository is here. Under no circumstances try to use this with jblandy’s excellent archer-mozilla JS magic right now. The current code is very distrustful of gdb.Value in a dumb way and does exceedingly dangerous things wherein pointers are bounced to strings and back to integers because direct integer coercion is forbidden. With pretty printers installed this is likely to break. Also, this is all only tested on 1.9.1.


Nice. I’ve been wanting this for *years*, and Chris Jones just asked me for a piece of source code I’d worked on a couple years ago to do exactly this.
This is the first step in what I have called a XPCOM debugger.
How can I help?
Thank you. Glad to have other interested parties!
First, an important caveat I forgot. I think there may be a minor special-casing to 32-bit in the code right now in get_js_string_from_atom.
Step 1 is to get yourself setup with a build of Python enabled gdb. Pull the git repo, switch to the branch listed here and build:
http://sourceware.org/gdb/wiki/PythonGdb
I suggest using a configure string like “./configure –with-python –program-prefix=archer-” to ensure that it doesn’t silently build without python if you are missing the deps and to avoid collisions with your local gdb.
Step 2 is to pull my hg repo.
Step 3 is to do what the README in the repo says in order to get your build of gdb going on.
Step 4 is to try and use the “mbt” command and see whether it works for you. Assuming it doesn’t immediately explode, try it out in a few cases, ideally.
Step 5 is to check out the documentation on the Python API for gdb. Do “make gdb.pdf” in gdb/doc. Section 23.2.2 is the Python API right now.
Step 6 is to try and clean it up. The existence and use of forceint and arguably getfield were (partially) motivated by a concern that constructing a gdb.Value for a (de-referenced) structure would immediately load all of the memory associated with that structure rather than only fetching memory for its sub-fields on-demand. I don’t actually know this to be true and probably was mis-interpreting something that happened with stringification. The python calls quickly disappear into gdb proper so it wasn’t immediately obvious what was actually going on. Also, I was using a remote target, so it was much more expensive to access the memory than it would be when done locally. (The other motivation was to keep the code as close to what I’d write in my VProbe script.)
If over-aggressive fetching is in fact occurring, several very specific requests via gdb.parse_and_eval could probably be used instead. Alternatively, the values fetched via getfield could be explicitly cast to an integer type of the same size as the pointer on the architecture.
Step 7 is to examine and improve the potential edge cases involving saved-off stack frames.
Step 8 would be enhancements. Things that currently cannot be done that someone might want would be: pretty-printing of the arguments to JS functions, actual correct JS PC display, actual correct JS line numbers rather than just displaying the function’s initial line number, exposure of the XPCOM interface being called through with XPConnect.