Understanding what is going on inside software can be very hard, even for the developers most familiar with the software. During my time working on Thunderbird I used a variety of techniques to try and peer inside: printf/dump/console.log, debuggers, execution analysis (dtrace, chronicle recorder, with object diffs, on timelines), logging (log4j style, with timelines, with rich data, extra instrumentation and custom presentations, prettier and hooked up to dump on test failures), improving platform error reporting, gdb extensions, control-flow analysis of SQL queries (vanilla, augmented with systemtap perf probes), performance analysis (VProbes with custom UI, systemtap, crammed into the SpeedTracer UI, custom UI with the async work), chewing existing log facilities’ output (TB IMAP, gecko layout), and asynchronous operation causality reconstruction (systemtap, JS promises).
Logging with rich, structured data easily provided the most bang-for-the-buck because it:
- Provided the benefit of baked-in human meaning with some degree of semantic hierarchy.
- Was less likely to make wrong assumptions about what data was relevant. How many times have you had to go back to change what a printf is logging?
- Once sufficiently automated, required no activation energy, no extra steps, and everyone can see the results.
However, it still has numerous downsides/gotchas:
- Potential performance impact, especially with rich, structured data.
- If people don’t write log statements, you don’t get log entries.
- If an error propagates and no one catches it or otherwise says anything about it, your log trace stops dead.
- Lack of context can hide causation and leave you filtering through tons of entries trying to reconstruct what happened from shadows on the cave wall.

As a result, when I recently started on a new project (implemented in JS), I tried to make sure to bake logging into the system from the ground up:
- The core classes, abstractions, and APIs generate log entries automatically so developers don’t need to fill their code with boilerplate.
- Loggers are built around object ownership hierarchies/life-cycles to provide context and the ability to filter. This is in contrast to log4j style logging which is usually organized around code module hierarchies, noting that log4j does provide nested diagnostic contexts.
- The test framework is designed around writing tests in terms of expectations around the loggers. This helps ensure interesting things get logged. It also improves the quality of the tests by making it easier to ensure the tests are really doing what you think they are doing.
- Logger definitions explicitly name the log events they will generate and their semantic type, some of which have special handling. The currently supported types are: state changes, latched states, events, asynchronous jobs (with separate begin and end entries), calls (which wrap a function call, catching exceptions), and errors. This allows specialized processing and better automated analysis without having to try and reverse engineer the meaning using regular expressions.
- Performance is addressed by instantiating different logger classes based on needs. For modules not under test (or without logging desired), everything turns into no-ops except for events and errors which are counted for reporting to a time-series database for system health/performance/etc analysis. The decision making process happens at runtime and is able to see the parent logger, so heavy-weight logging can be used on a statistical sampling basis or only for specific users experiencing problems/etc.
- Loggers can give themselves complex semantic names that can be used to reconstruct relationships between loggers when the ownership hierarchy is not available or not appropriate. For example, we can link both sides of the connection between a client and a server by having the loggers make sure to name themselves and the other side.
- Simple wrapper helpers exist that make it easy to wrap a function so that a custom log entry is generated and it “holds” the call in limbo from whence it can later be “released”. This allows unit tests to break complicated behaviour into discrete steps that humans can understand. Far better to look at one thing at a time than eight things all jumbled together (or filtered back down to one, potentially hiding important details).

In any event, as one might surmise from the screenshots, this is more than a dream, it’s a pastel colored reality.
What are the screenshots showing?
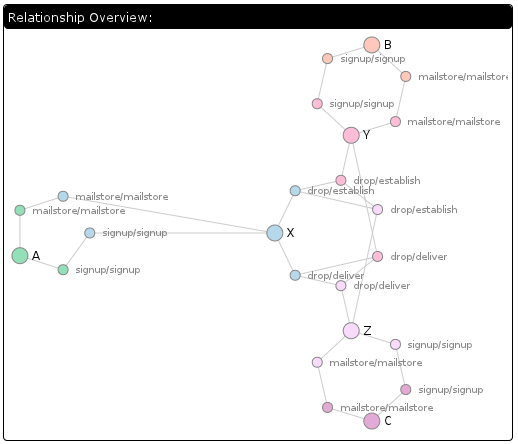
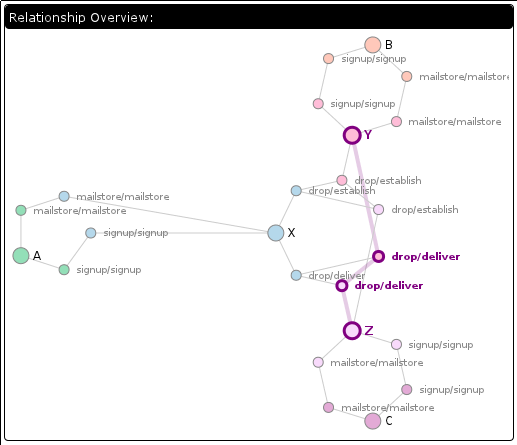
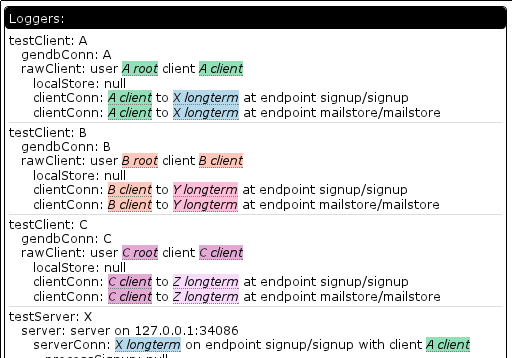
- The logger hierarchy. The colored bits are “named things”. The test framework has the concept of things, actors, and loggers. Each actor corresponds to exactly one logger and is the object on which tests specify their expectations. Actors can be owned by other actors, resulting in a hierarchy we call a family. Each family gets tagged with a distinct identifier that allows us to associate a color with them. Things provide a human name to a (hopefully) unique string. Things can be owned by actors and get tagged with the family name and so can be colorized. In the logger hierarchy, the stuff to the right of the colon is the semantic name of the logger. So “clientConn: A client to X longtermat endpoint blah” is really (under the hood) an array of strings where “A client” is actually the crypto key so named. There are two colors because the connection is naming both its own identifying crypto key and the server’s crypto key it is trying to talk to.
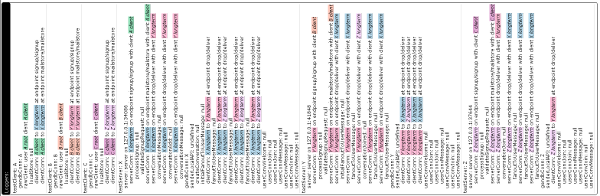
- An example of the display of log entries. Each logger gets its own column to display its entries in. The header shows the name of the logger and is colored based on that logger’s family. The colors were not shown in the logger hierarchy because I think it would end up too busy. Each entry is timestamped with the number of milliseconds since the start of the test. The event names are arbitrarily in blue to help delineate them from other semantic classes. For example, “handleMsg” is a call-type. The “obj” bits with the dotted stuff under it means something we can click on to see more of. The events being shown are part of a CurveCP-style connection establishment.
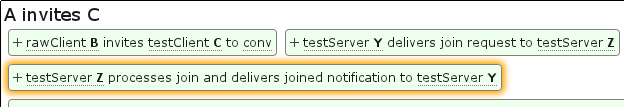
- Similar to the previous screenshot, but here you can see named thing resolution in play with arguments that are strings.
- And if we click on one of those “obj” bits, we get a nice nested table display of the object. As you can see from the pretty colors, named thing resolution is also in play. You can also see crypto keys I did not name and which accordingly look like gibberish. It is probably worth noting that some developer participation is required to make sure to put toJSON() implementations on all the complex objects that are exposed to the logger to make sure we don’t try and serialize huge swathes of object graph. While this is a “don’t break the system” requirement, it also makes it easy to expose the useful bits of information for debugging.

If you would like to see the actual log display UI for yourself on the log from the screenshots (and can stomach it fetching 2+ MiB of compressed JSON), you can see it at https://clicky.visophyte.org/examples/arbpl-loggest/20110712/. While the logs normally live on the ArbitraryPushlog (ArbPL) server, links to it are currently not stable because its all-in-one hbase datastore keeps self-destructing. I baked ArbPL into a standalone form that lives at that URL and so should ideally not break so much. Fingers-crossed.