Chroniquery slightly more chronoriffic

So, I was playing with the fantastic Chronomancer (roc‘s announcement, project link), an Eclipse GUI for chronicle-recorder, using a trace from my PyXPCOM troubles. I discovered a lack of some symbols that seemed like they should be there and decided to then run chronicle against chronicle-query and view the problem in Chronomancer so that I might smite it. Unfortunately, some stuff didn’t show up in that trace, so I went investigating by way of enhancing chroniquery so that I might better understand the problem while also making chroniquery more usable. Sadly, there’s still more work to be done, but I have a picture to show and I understand a good deal of the chronomancer internals now and how to drive chronicle-query better.

chroniquery against fancy, tracing main, minor issues

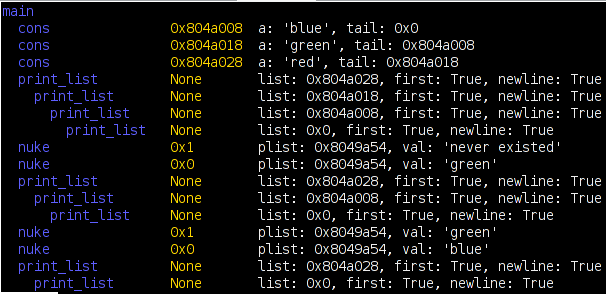
The above is pretty representative of what chroniquery’s chronisole can now do. It’s an invocation of chronisole.py trace fancy -f main. The ‘fancy’ program builds a linked list using ‘cons’, uses the recursive ‘print_list’ to print the list, and uses the iterative ‘nuke’ to delete entries from the list. ‘cons’ returns the newly allocated list entry/cons cell, and nuke returns 0 if the entry existed and was nuked or 1 if it didn’t exist. We traced main because of the -f; we could start with any bunch of functions as the root, and can use -x to filter out noisy functions from the recursive function discovery. Return values and parameters are shown.

Of course, even in this example, the first/newline booleans are wrong, presumably indicative of some wackiness/off-by-one-error in my mechanism for determining the sub-called functions’ function entry timestamps. I’m confident I’m doing some foolish things, but it will have to wait until the weekend and a more well-rested brain. I’ve pushed the changes to the bzr tree if anyone wants to do my work for me.

some practicality comes to visophyte town

In a nod to making useful visualizations, the marker infrastructure has been beefed up. The linear mapper now has reasonable heuristics to use pretty round numbers. And the time mapper has all sorts of time ranges under its belt.

weather vis demo, year time range

While I have thoughtfully left out units, there is now at least a chance of someone guessing that the above is a graph of the high, average, and low temperatures for somewhere in some year. Maybe someone really fancy could narrow it down by figuring out when the various inconsistent holidays fall and the overall temperature trends. But I’ll spoil the fun; it’s Dulles, VA in 2006! Thanks to a CF6 ‘Preliminary Climatology Data’ parser/’data feed’ we have a limitless* source of data which is only good for examples. Also, thank you weather.gov.

weather vis demo, june

This one is just the month of June. The non-intuitive numbers are ISO weeks. Overkill demands the ‘rulers’ that provide the date ranges eventually be capable of visualizing data themselves**, but for now they just derive their colors from primitive theming support which is also new.

I should probably note that I have begun to push my bzr repository to this server (/rev_control/bzr/visophyte) simply because I can’t think of a reason not to. The visophyte code proper is LGPL v3, but examples are MIT/X11 (though they need to be more explicitly labelled as such). That said, the code is still in an aggressive state of flux and I suggest no one even bother looking at it. Simply put, I keep adding features as needed, and the waves of non-backwards-compatible constraint/feature propagation often need to ripple through the entire codebase. And when I say ripple, I mean ripple; it’s not instantaneous.

* For the purposes of this asterisk, limitless still involves limited cutting and pasting. The parser likes to read files, not interwebs.

** Although I am likely to use such functionality to render the rulers useless and somewhat gaudy, there are sane possibilities too.