logsploder, circa a year+ ago

Whoops.  I posted to mozilla.dev.apps.thunderbird about an updated version of logsploder at the end of 2009, but forgot to blog about it.  I do so now (briefly) for my own retrospective interest and those who like cropped screenshots.

The gloda (global database) tests and various Thunderbird mozmill tests have been augmented for some time (1+ years) to support rich logging where handlers are given the chance to extract the salient attributes of objects and convert them to JSON for marshaling.  Additionally, when the fancy logging mode is enabled, additional loggers are registered (like Thunderbird’s nsIMsgFolderListener) to provide additional context for what is going on around testing operations.

For a given test (file) run, logsploder provides an overview in the form of a hierarchical treemap that identifies the logger categories used in the test and a small multiples timeline display that characterizes the volume of messages logged to each category in a given time slice using the treemap’s layout.  The idea is that you can see at a glance the subsystems active for each time-slice.

Logsploder can retain multiple test file runs in memory:

And knows the tests and sub-tests run in each test file (xpcshell) run.  Tests/sub-tests are not green/red coded because xpcshell tests give up as soon as the first failure is encountered so there is no real point:

Clicking on a test/subtest automatically selects the first time slice during which it was active.

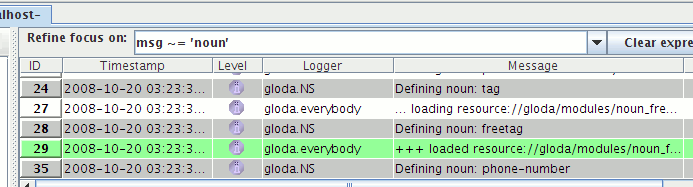
Selecting a time-slice presents us with a simple list of the events that occurred during that time slice.  Each event is colored (although I think darkened?) based on its logging category:

Underlined things are rich object representations that can be clicked on to show additional details.  For example, if we click on the very first underlined thing, “MsgHdr: imap://user@localhost/gabba13#1” entry, we get:

And if we click on the interestingProperties OBJECT:

Logsploder was a pre-wmsy (the widget framework that I’ll be talking about more starting a few weeks from now) tool whose UI implementation informed wmsy.  Which is to say, the need to switch to a different tab or click on the “OBJECT” rather than supporting some more clever form of popups and/or inline nesting was a presentation limitation that would not happen today.  (More significantly, the log events would not be paged based on time slice with wmsy, although that limitation is not as obvious from the way I’ve presented the screenshots.)

If anyone in the Thunderbird world is interested in giving logsploder a spin for themselves, the hg repo is here.  I also have various patches that I can cleanup/make available in my patch queue to support logging xpcshell output to disk (rather than just the network), hooking up the logHelper mechanism so it reports data to mozmill over jsbridge, and (likely heavily bit-rotted) mozmill patches to report those JSON blobs to a CouchDB server (along with screenshots taken when failures occur).  The latter stuff never hit the repo because of the previously mentioned lack of a couchdb instance to actually push the results to.  Much of the logHelper/CouchDB work will likely find new life as we move forward with a wmsy-fied Thunderbird Air experiment.

Many thanks to sid0 who has continued to improve logHelper, if sometimes only to stop it from throwing exceptions on newly logged things that its heuristics fatally did not understand 🙂

LogSploder, logsploding its way to your logs soon! also, logsplosion!

logsploder screenshot with gloda

In our last logging adventure, we hooked Log4Moz up to Chainsaw.  As great as Chainsaw is, it did not meet all of my needs, least of all easy redistribution.  So I present another project in a long line of fantastically named projects… LogSploder!

The general setup is this:

  • log4moz with a concept of “contexts”, a change in logging function argument expectations (think FireBug’s console.log), a JSON formatter that knows to send the contexts over the wire as JSON rather than stringifying them, plus our SocketAppender from the ChainSaw fun.  The JSONed messages representations get sent to…
  • LogSploder (a XULRunner app) listening on localhost.  It currently is context-centric, binning all log messages based on their context.  The contexts (and their state transitions) are tracked and visualized (using the still-quite-hacky visophyte-js).  Clicking on a context displays the list of log messages associated with that context and their timestamps.  We really should also display any other metadata hiding in the context, but we don’t.  (Although the visualization does grab stuff out of there for the dubious coloring choices.)

So, why, and what are we looking at?

When developing/using Thunderbird’s exciting new prototype message/contact/etc views, it became obvious that performance was not all that it could be.  As we all know, the proper way to optimize performance is to figure out what’s taking up the most time.  And the proper way to figure that out is to write a new tool from near-scratch.  We are interested in both comprehension of what is actually happening as well as a mechanism for performance tracking.

The screenshot above shows the result of issuing a gloda query with a constraint of one of my Inbox folders with a fulltext search for “gloda” *before any optimization*.  (We already have multiple optimizations in place!) The pinkish fill with greenish borders are our XBL result bindings, the blue-ish fill with more obviously blue borders are message streaming requests, and everything else (with a grey border and varying colors) is a gloda database query.  The white bar in the middle of the display is a XBL context I hovered over and clicked on.

The brighter colored vertical bars inside the rectangles are markers for state changes in the context.  The bright red markers are the most significant, they are state changes we logged before large blocks of code in the XBL that we presumed might be expensive.  And boy howdy, do they look expensive!  The first/top XBL bar (which ends up creating a whole bunch of other XBL bindings which result in lots of gloda queries) ties up the event thread for several seconds (from the red-bar to the end of the box).  The one I hovered over likewise ties things up from its red bar until the green bar several seconds later.

Now, I should point out that the heavy lifting of the database queries actually happens on a background thread, and without instrumentation of that mechanism, it’s hard for us to know when they are active or actually complete.  (We can only see the results when the main thread’s event queue is draining, and only remotely accurately when it’s not backlogged.)  But just from the visualization we can see that at the very least the first XBL dude is not being efficient with its queries.  The second expensive one (the hovered one) appears to chewing up processor cycles without much help from background processes.  (There is one recent gloda query, but we know it to be cheap.  The message stream requests may have some impact since mailnews’ IMAP code is multi-threaded, although they really only should be happening on the main thread (might not be, though!).  Since the query was against one folder, we know that there is no mailbox reparse happening.)

Er, so, I doubt anyone actually cares about what was inefficient, so I’ll stop now.  My point is mainly that even with the incredibly ugly visualization and what not, this tool is already quite useful.  It’s hard to tell that just from a screenshot, since a lot of the power is being able to click on a bar and see the log messages from that context.  There’s obviously a lot to do.  Probably one of the lower-hanging pieces of fruit is to display context causality and/or ownership.  Unfortunately this requires explicit state passing or use of a shared execution mechanism; the trick of using thread-locals that log4j gets to use for its nested diagnostic contexts is simply not an option for us.

Log4Moz and Chainsaw (via new XMLFormatter/SocketAppender)

Log4Moz, the premier mozilla-centric javascript logging framework has just gotten more… premier.

A picture of chainsaw with gloda

By hooking Log4Moz up to Chainsaw, Apache log4j’s pretty UI, we get a UI with some powerful features.  Namely, you can filter based on message text (using a regex even), level, source, etc.  Also, you can colorize the entries using the same expression mechanism.  In the screenshot below, you can see I have filtered to show only the messages with the word “noun” on them, and changed the background color of messages with “+++” in them.

Chainsaw! Gloda! Filters!

The enhancements made to Log4Moz are to provide an XMLFormatter that rolls in a similar fashion to log4j’s XMLLayout and a SocketAppender that never forgets… to kill!  And by kill, I mean establish TCP connections.

If you are a gloda user and upgraded to the version I told you to expressly not upgrade to, then you can use this new functionality by creating a file “/tmp/chainsaw.ptr” with the contents “localhost:4448”.  Run Chainsaw, create an XMLSocketReceiver, and Bob’s your uncle.  Unfortunately, Bob is not your uncle when it comes to building chainsaw.  While maven no longer entirely angries up my blood, the process still leaves something to be desired.  (Using this ~/.m2/settings.xml with “-P default” may take fewer years off your life if you take this path.)

These enhancements are currently in the gloda repository, and perhaps will make their way back upstream or what not?  (Land them quick, before I add all forms of crazy helpers like JSON-ing extra arguments and sending them across the wire too!)

UPDATE: Of course, it’s always a good idea to pull from the tip, as the revision linked above had a bit of foolishness with timeouts.