At the beginning of last week, I had gotten dtrace working on a Mac Mini using the Mozilla javascript-provider probes. Very cool stuff, but it left me with several questions about what would really be best to do next:
- How do I best understand what I’m seeing? (Most of the codebase is brand new to me…)
- How do I share the data with others in a way that is both comprehensible and allows them to draw their own conclusions from the data?
- What can I do to reduce the effort required to work on performance problems?
I was tempted to just try and just dig into the system so I could have something to show immediately, but I knew it would still take a while to see the big picture just using an editor/ctags/lxr/opengrok, even informed by dtrace. And even then, that big picture doesn’t scale well; whatever picture I managed to formulate would be stuck inside my head…

So my solution was to try and build a tool that could help me accomplish my short-term goals soon, and have the potential to grow into a usable solution to all of the above… eventually. The goal, in a nutshell, is to provide a code browser for javascript that is able to integrate performance information (retrieved from traces) alongside the code. Seeing that lxr/mxr and opengrok didn’t understand javascript or XBL all that well, it also seemed feasible to try and improve on their browsing capabilities for javascript. A far-down-the-road goal is also to be able to pull in information from the underlying C++ code as well, potentially leveraging dehydra, etc. (This would primarily be for understanding what happens when we leave the javascript layer, not trying to be the same solution for C++ space.)
So what can it do so far? You can go try it for yourself if you like as long as you keep your expectations very low and realize the current state does not reflect all of the bullet points below. Also, you probably want firefox 3.0. Or you can read my bullet points:
- Parse custom DTrace script output! The Mozilla DTrace probe points could probably use a little love to improve what we are able to get out. Also, I think it’s betraying us somewhere.
- Parse JavaScript! Sorta! (I hacked in support for the regular expression syntax, but I haven’t corrected the ambiguity with division, so things with division break. Also, there’s at least one or two other glitches that cause early termination.) [Yay antlr!]
- Parse XBL! Even with entity inlining! Even when people put #ifdefs in the XML document! Sorta! We don’t actually do anything intelligent with the XBL right now or with its JavaScript, but it won’t take much to get that much improved. [Yay elementtree!]
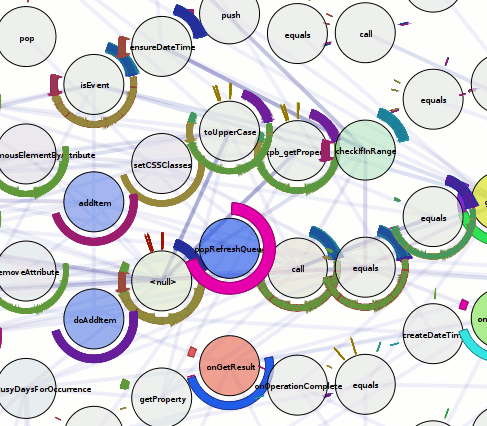
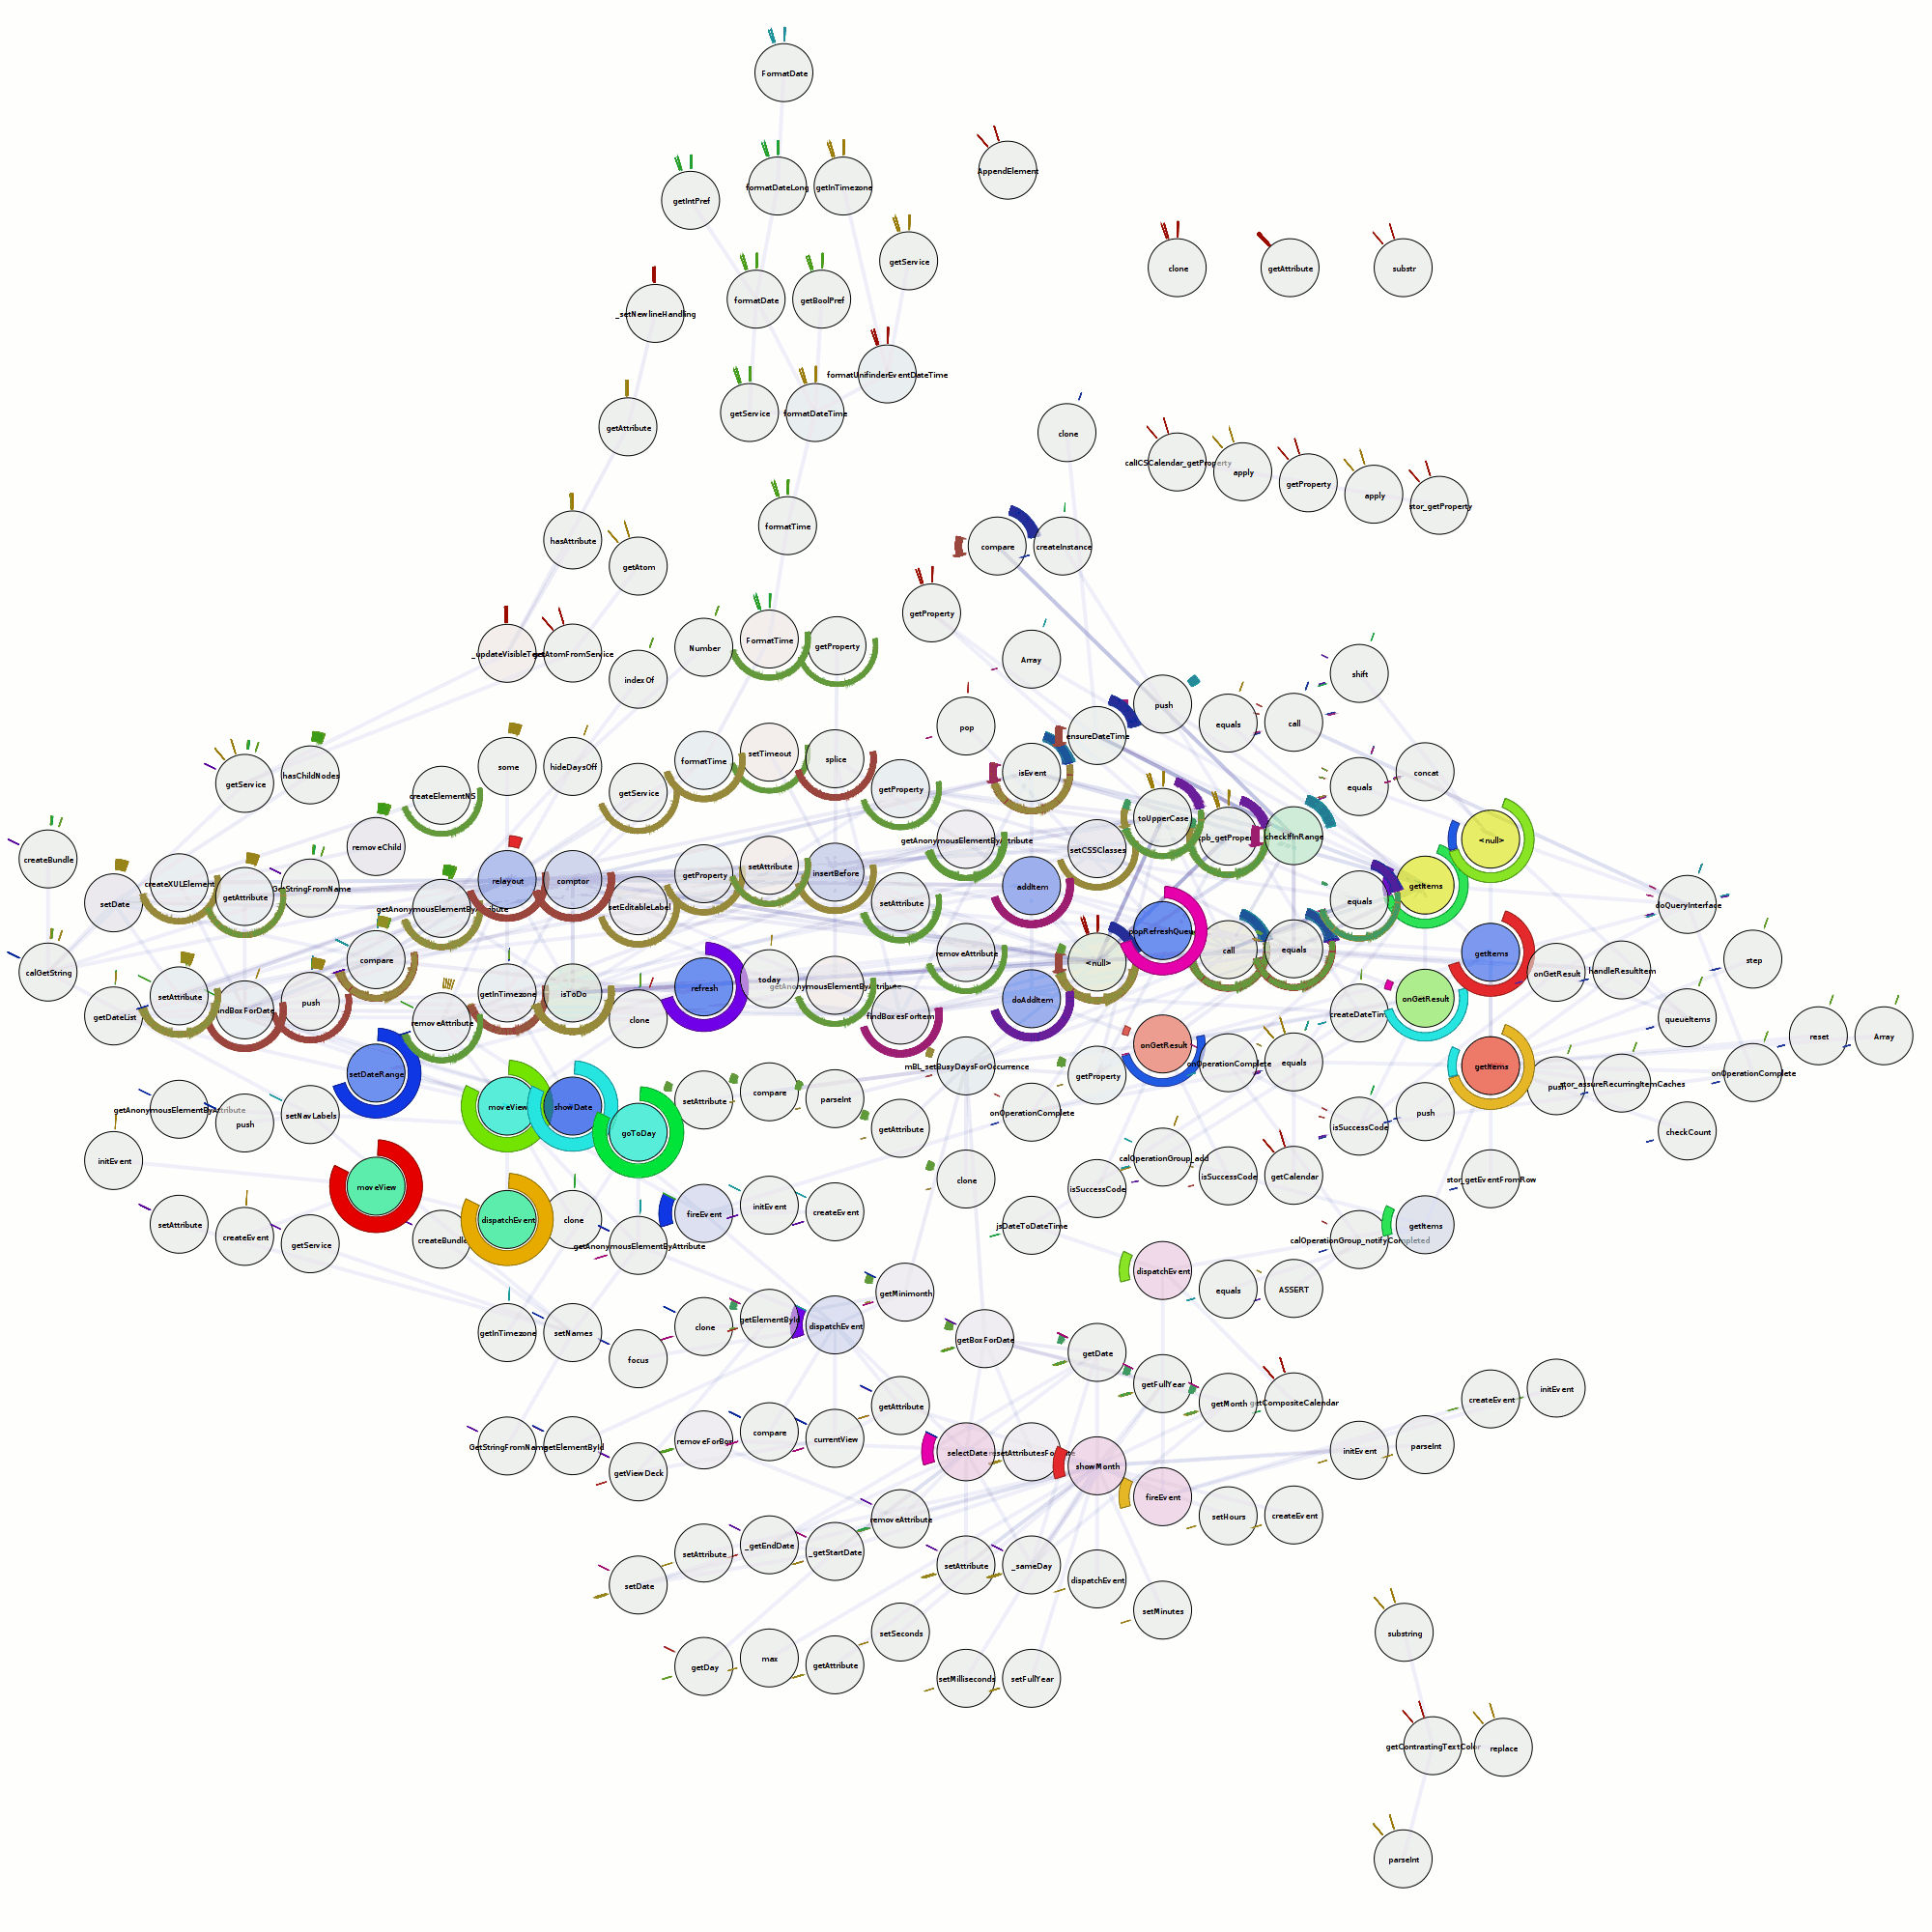
- Visualize some stuff! Inter-file relationship graph in the overview. In the code and ‘Funcs’ sidebar tab you get a sparkbar where each bar represents a time interval. The height of the par is the percentage of possible time we could have spent in that time interval. Red means we belive that time was spent in the function itself, green means we think we spent that time in calls to other functions. [Yay visophyte!]
- Navigate with history! Click on the overview graph and you go to things. Click on the file names in the ‘Files’ list and you go to the files. I tried to make it so you could click on function names in the side bars to go to them, but jquery.scrollTo and/or firefox 3.0b5 had serious crashing issues. [Yay jquery, jquery.history!]
- See syntax-highlighted code with random headings intertwined (shows the parser worked) and potentially a visualization. [Yay pygments!]

My hope in the near-term is to fix the outright bugs (parsing issues), get XBL going, and then augment the function information with more trace-derived data including more traditional call-stacks, etc. Then the tool should be sufficiently usable that my immediate focus can change to creating automated tests to actually gather performance/execution traces so we can use the tool for what I started it for. This may also get shelved for a while if it turns out that we need action (patches) immediately.