displaying execution traces on a SIMILE timeline

chronimoz-timeline-1

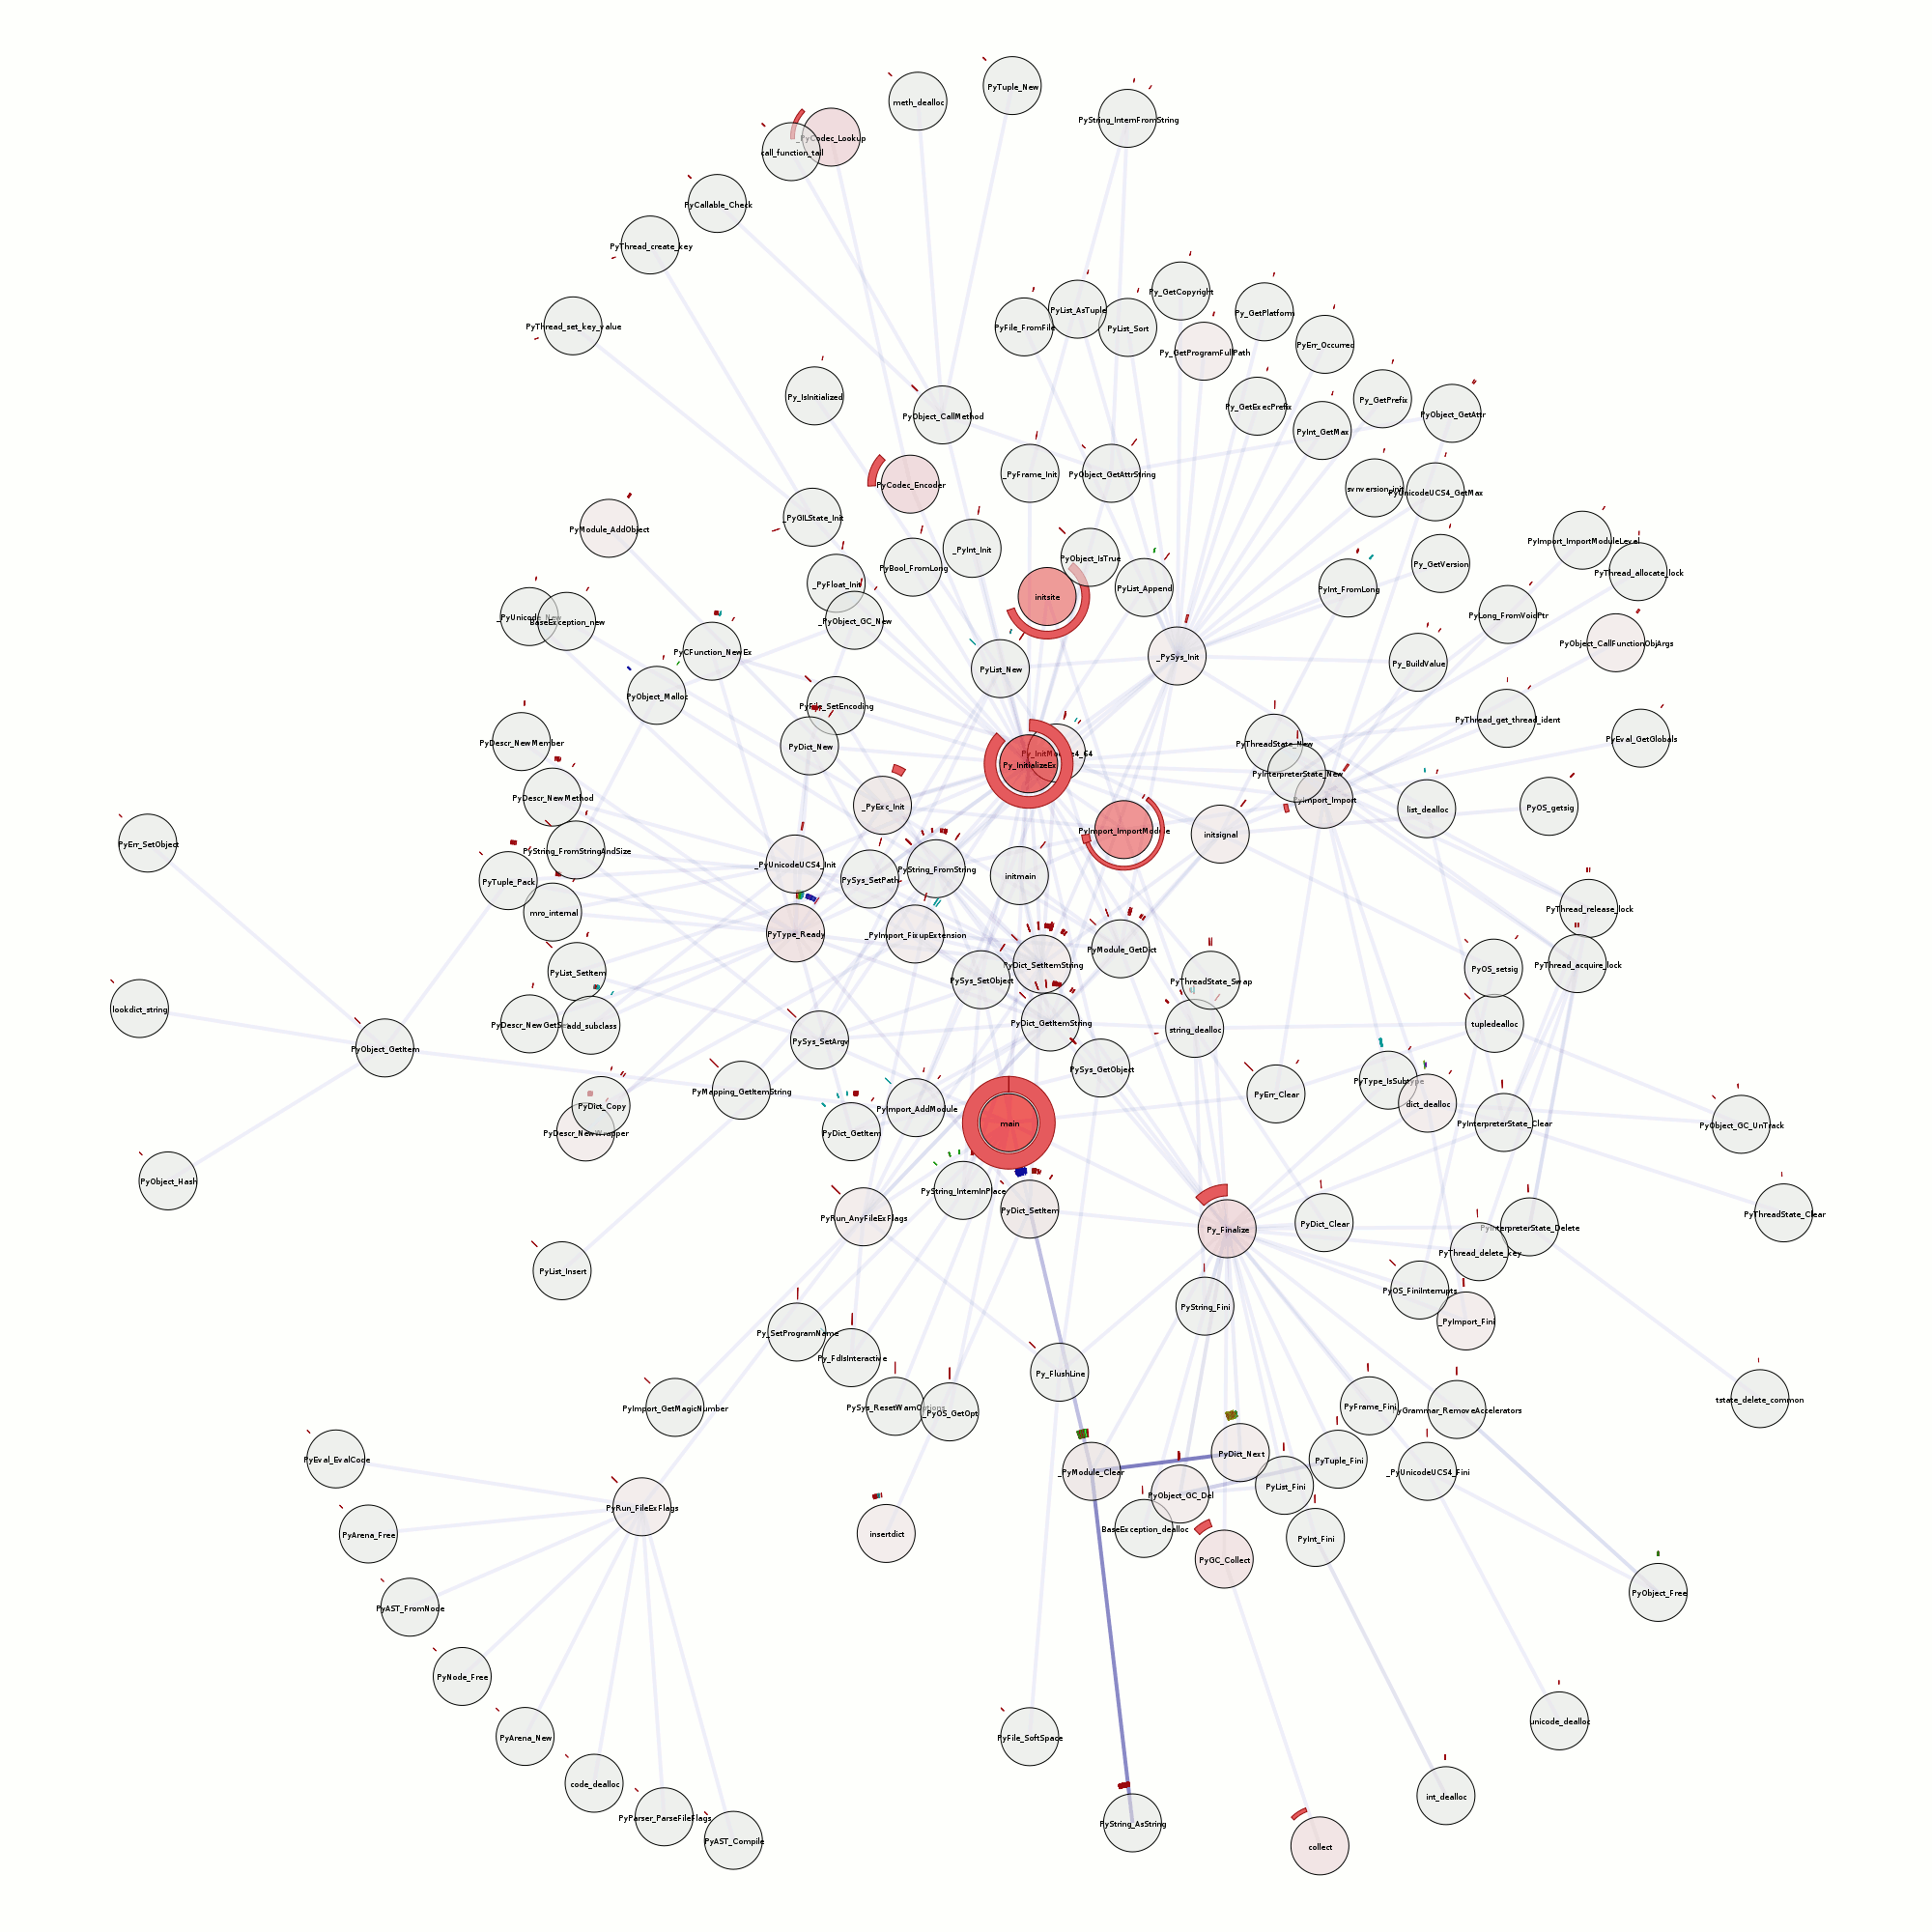
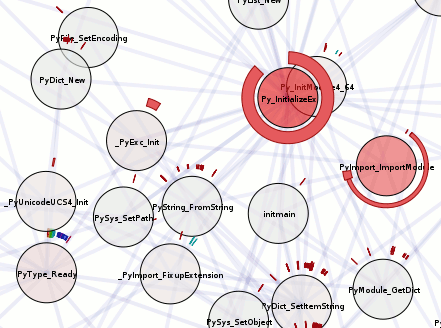
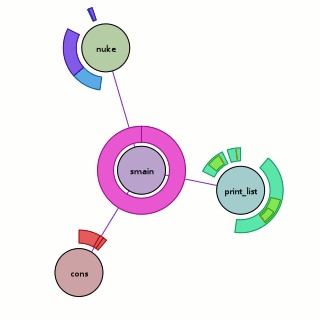
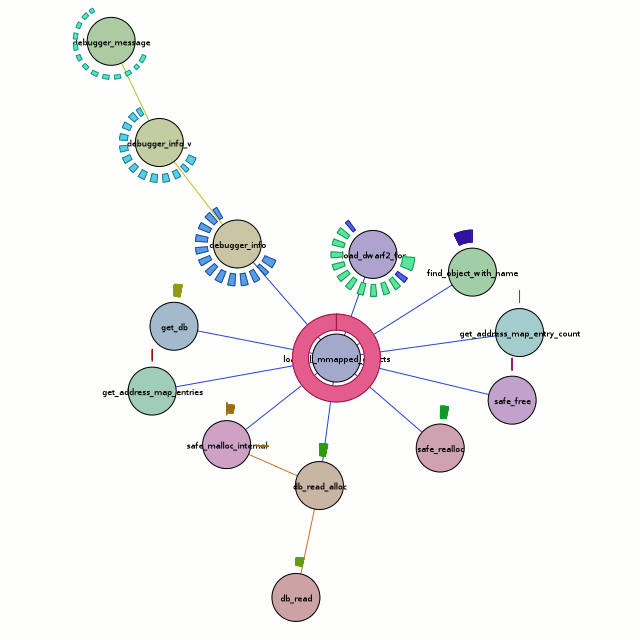
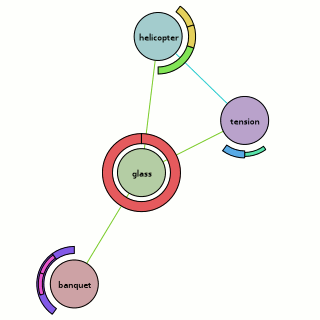
chroniquery can now output JSON for display using the SIMILE timeline widget.  And I am finally done trying to figure out what was going wrong.  Click the pictures to experience the timeline sensation for yourself.

Related interesting things:

  • Supports a fancy if specific constraint mechanism.  For example, PrepareAndDispatch is only displayed in the context of nsTimerImpl::Fire using the following line in the config file:
[func@PrepareAndDispatch]
only_show_if=backtrace,4,nsTimerImpl::Fire
  • Supports displaying arguments in the title using the config file.  For example, displaying the observer service’s topic (plus putting it in its own band and giving it a nice prefix):
[class@nsObserverService]
prefixAlias=Obs:
band=context
list_args=aTopic
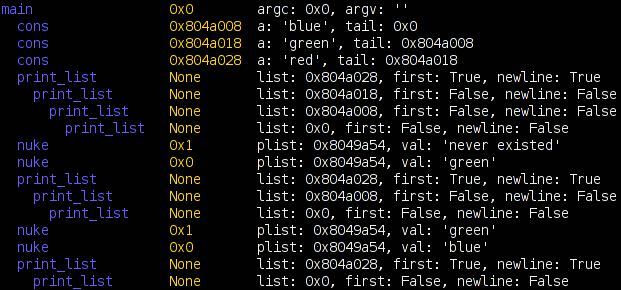
  • We actually get the dump() output by logging where _IO_fputs shows up.  We constrain its output by adding an extensible (if currently somewhat specialized) argument-based constraint.
  • Things in red are red because their return codes were exceptional, per my last blog post.  Things in other colors are that way because of the config file.
  • The bubbles that show up when you click on things tell you the return value and arguments for the call in question.  We could include a backtrace, but they are expensive to compute (currently), so I don’t.
  • All layout is using the timeline widget’s layout.  There is no correspondence between stack depth and anything else.

chronimoz-timeline-2

An important limitation is that all functions displayed here were explicitly chosen for display.  Some form of automated mechanism could be used, but unless chronicle-query starts caching more things, it would be really slow.  Here’s the command-line used for the above:

chron-xpc mozrun-9022.db jsontrace -t 1 -f nsObserverService::NotifyObservers -f nsThread::ProcessNextEvent -f nsTimerImpl::Fire -f nsMsgSearchSession::NotifyListenersDone -f nsMsgDBFolder::Shutdown  -f nsMsgLocalMailFolder::AddMessage -f nsMsgDatabase::Open -f nsMsgDatabase::ForceClosed -f nsMsgLocalMailFolder::GetDatabaseWithReparse -f nsMsgDBFolder::OnAnnouncerGoingAway -f nsMsgDBFolder::AddSubfolder -f nsMsgSearchOfflineMail::OpenSummaryFile -f nsMsgSearchSession::TimerCallback -f nsMsgSearchSession::TimeSlice -f nsMsgSearchSession::TimeSliceSerial -f nsMsgSearchScopeTerm::TimeSlice -f nsMsgXFVirtualFolderDBView::Open -f nsMsgXFVirtualFolderDBView::OnNewSearch -f nsMsgXFVirtualFolderDBView::OnSearchDone  -f js_GC -f PrepareAndDispatch -f nsMsgLocalMailFolder::UpdateFolder -f _IO_fputs

understanding where unit tests go wrong with object diffs

chronimoz-diff-1

In our last chroniquery adventure, we used roc‘s chronicle-recorder to trace the execution of an xpcshell unit test and chroniquery (repo info) to use that trace to help us understand what was happening in some particularly confusing C-ish code.  Actually, we’re doing that this time too, but the bag of tricks now contains additional tricks.

The exciting things happening in the screenshot above, in order of increasing awesomeness:

  • The argument list is exposing out-parameters (via a heuristic though, it doesn’t know the XPCOM details.)  ex: “*folderInfo: 0x0” used to be “folderInfo: some pointer to hold an out-parameter that leaves us none the wiser.”
  • Chronifer now sees through ‘this’-adjusting trampolines/wrappers.  Previously, function calls might be hidden because the stack pointer change that chronicle uses to determine function calls jumped to the trampoline whose bytecode was not associated with the actual function being called, and so would potentially be assumed to be boring.  The trampoline would modify rdi then perform a trivial jump (it could have just fallen through) into the function proper, which the existing trampoline detector would not notice.  (That detector only would notice an instant jump of more than 128 bytes; intended for dynamic linking indirection purposes.)
  • Pretty printers allow us to translate nsresult error codes to strings, display the strings referenced by nsString/nsCString instead of the raw structure (mData/mLength/mFlags), pierce nsCOMPtr’s, etc.
  • Pretty printers allow us to detect exceptional values and show them in red!  For example, that NS_ERROR_INVALID_POINTER is red because the nsresult pretty printer’s is_exceptional method returned True because the error bit was high.
  • The configuration method that lets us say what directories/files/classes/functions are interesting/boring has been augmented to let us specify arguments and the sub-fields of arguments to dump.  For example, in the above screenshot, we have added “dump_this=True” to the section labeled “[class@nsMsgLocalMailFolder]”.  As a result, any time a method is called on nsMsgLocalMailFolder, we dump the contents of its ‘this’.  If we only wanted a few fields from “this”, we could have used “dump_this=mPath,mIsServer,mName,mURI” instead.  You can see the end of a full object dump at the top of the screenshot.
  • The object dump output is diffed against the result of previous calls.  This is why we have that text in yellow.  The first entire GetDBFolderInfoAndDB call you see on the screen is a succesful call (no red!) diffed against a previous successful call.  Mainly we see the name-derived things changing and things we expect to be distinct (file path, database).  Then we have an error case, with a few things we probably would not have noticed if we were doing this by hand.  I was somewhat surprised that mHaveParsedURI, the reference count, and m_numOfflineMsgLines showed up.  The others are not entirely shocking, but it’s useful to have them all there.  Without the diff, we would be looking at 65 lines of attribute values, and that is with us already benefitting from the pretty printers.

Exciting possibilities opened by enhancements here:

  • The pretty printers and internal cleanups/refactoring make it feasible to express complicated data-based constraints simply.  For example, with a tractable amount of work I could opt to only see calls on the folder named “gabba3” using the constraint “mURI == ‘mailbox://nobody@Local%20Folders/gabba0′”.  This could be made particularly efficient if we make an assumption that the attribute is invariant once observed and then allow us to key off the pointer/memory region.
  • Code-sharing of pretty printers between my chroniquery code and my archer gdb plugins.
  • Now that archer-gdb has python inferior control, potential use of archer-gdb as an alternate back-end to chroniquery.
  • It would be neat to be able to expose chroniquery’s functionality via a web interface so that things could be expanded/drilled down without having to re-run things.  This would also help offset the non-trivial startup costs to chronicle-recorder’s own chronicle-query.  (Although arguably the startup time is nothing compared to the inefficiency of all the work chronicle-query does for a call and throws away when the next call pretty much wants that same data.)

understanding libmime using chroniquery and unit tests

chroniquery-trace-failed-return-value

Mailnews’ libmime is one of the harder modules to wrap one’s head around.  8-letter filenames where the first four letters tend to be “mime”, home-grown glib-style OO rather than actual C++, and intermingling of display logic with parsing logic do not make for a fun development or even comprehension experience.

Running an xpcshell unit test run under roc‘s chronicle-recorder and then processing it with my chroniquery stuff (repo info), we get a colorful HTML trace of the execution somewhat broken out (note: pretend the stream_write/stream_completes are interleaved; they are paired).  Specific examples of libmime processing for the inquisitive (there are more if you check the former link though):

The thing that kickstarted this exciting foray is the error pictured in the screenshot above from an earlier run.  The return values are in yellow, and you can see where the error propagates from (the -1 cast to unsigned).  If you look at the HTML file, you will also note that the file stops after the error because the functions bail out as soon as they hit an error.

However, our actual problem and driving reason for the unit tests is the JS emitter choking on multipart/related in writeBody (which it receives by way of ‘output_fn’).  Why?  Why JS Emitter?!  (You can open the links and control-F along at home!)

  • We look at the stream_write trace for our multipart/related.  That’s odd, no ‘output_fn’ in there.

chroniquery-stream_complete-output_fn

  • We look at the stream_complete trace for the multipart/related.  There’s our ‘output_fn’!  And it’s got some weird HTML processing friends happening.  That must be to transform links to the related content into something our docshell can render.  This also explains why this processing is happening in stream_complete rather than stream_write… it must have buffered up the content so it could make sure it had seen all the ‘related’ documents and their Content-IDs so it could know how to transform the links.
  • Uh oh… that deferred processing might be doing something bad, since our consumer receives a stream of events.  We had to do something special for SMIME for just such a reason…
  • We check stream_complete for ‘mimeEmitterAddHeaderField’ calls, which the JS emitter keys off of to know what part is currently being processed and what type of body (if any) it should expect to receive.  Uh-oh, none in here.

chroniquery-stream_write-addheaderfield

  • We check stream_write for ‘mimeEmitterAddHeaderField’ calls, specifically with a “Content-Type” field.  And we find them.  The bad news is that they are apparently emitted as the initial streaming happens.  So we see the content-type for our “text/html”, then our “image/png”.  So when stream_complete happens, the last thing our JS emitter will have seen is “image/png” and it will not be expecting a body write.  (It will think that the text/html had no content whatsoever.)
  • Khaaaaaaaaaaaaaaaaaaaaaaaaan!

In summary, unit tests and execution tracing working together with pretty colors have helped us track down an annoying problem without going insane.  (libmime is a lot to hold in your head if you don’t hack on it every day.  also, straight debugger breakpoint fun generally also requires you to try and formulate and hold a complex mental model… and that’s assuming you don’t go insane from manually stepping aboot and/or are lucky with your choices of where you put your breakpoints.)  The more important thing is that next time I want to refresh my understanding of what libmime is up to, I have traces already available.  (And the mechanics to generate new ones easily.  But not particularly quickly.  chronicle and my trace-generating mechanism be mad slow, yo.  It may be much faster in the future to use the hopefully-arriving-soon archer-gdb python-driven inferior support, even if it can’t be as clever about function-call detection without cramming int 0x3’s all over the place.)

Useful files for anyone trying to duplicate my efforts: my ~/.chroniquery.cfg for this run, the unit test as it existed, and the command-line args were: trace -f mime_display_stream_write -f mime_display_stream_complete -c -H /tmp/trace3/trace.html –file-per-func-invoc

chroniquery does useful things!

Before pecobro, there was chroniquery (shiny, also shiny, texty), a python binding for roc‘s chronicle-recorder omega-debugger.  Now, there is still chroniquery.  It just does more stuff, and does the stuff it previously did more correctly.

In any event, what the awesome ‘screenshot’ (it’s from a console…) shows:

  • A trace from running chronicle-recorder against xpcshell on amd64 running a gloda unit test.
  • Javascript being ‘traced’ with extraction of the function name, script, and line number… everything you’d expect from your dtrace probes or your JSD hooks/venkman/firebug…
  • Hm… it seems to know something about an XPConnect call going down…
  • Oh noes!  It has escaped into the C++ codes!

chronicle-recorder and amd64, hooray!

overview: visichron.py trace python -f main -d 3

My personal laptop rolls amd64-style (rather than i686), and chronicle-recorder’s valgrind component was not working on it (“illegal instruction”). I have done some vendor-branch dancing to get chronicle-recorder’s valgrind sub-directory to use valgrind 3.3.0. A bzr branch of just the valgrind subdirectory (drop-in or build separately and make sure you invoke valgrind from that location) is available here: http://www.visophyte.org/rev_control/bzr/valgrind-chronicle/valgrind-chronicle/

A probably faster location to bzr branch from is here: http://clicky.visophyte.org/rev_control/bzr/valgrind-chronicle/valgrind-chronicle/

and a tarball of the tip is here: http://www.visophyte.org/rev_control/tarballs/valgrind-chronicle-r6.tar.bz2

I have also updated chroniquery (my python binding for chronicle-query’s JSON interface, and its own set of tools that build on it) to work with amd64. Its bzr branch is here: http://www.visophyte.org/rev_control/bzr/chroniquery/trunk/

The goal of all of this was to be able to run chronicle against Thunderbird, which I was able to do. Unfortunately, visichron (the visualizing part of chroniquery using visophyte) is not quite ready for such an undertaking at this time.  (Not to mention a few C++ symbols issues…)

snippet: visichron.py trace python -f main -d 3

However, it was powerful enough to handle visualizing the trace resulting from invoking python on a python file with just “print ‘hello world'” in it. So that’s what you see here, albeit limited to only 3 call levels deep. Click on the upper picture to see the whole thing at 2000×2000, or just look on the lower picture to get an idea of what’s going on. Just like my first post using visichron, the rings are colored based on a (naive) control-flow-taken basis. The ring colors are per-function, however. Also, the node colors are ‘hot’ colored based on how many ‘ticks’ were spent inside the functions, multiple counting for recursion.

Other interesting changes include some primitive watch functionality for chronisole’s ‘trace’ mode. Also, the previously unmentioned readchron.py now understands and prints BunchedEffect and RegEffect info. (readchron aspires to be along the lines of readelf for chronicle databases, but with more colors.)

Chronicle-Recorder Graph/Ring Visualization! Hooray!

Thanks to new and improved time management skills (and a holiday weekend doesn’t hurt), I’ve got a chronicle-recorder visualization going on via chroniquery:

visichron.py trace vfancy -f smain

Above, we have the visualization run against the ‘fancy’ program seen in the previous chroniquery posts (with one caveat, addressed later). What does it mean?

  • The circular nodes are functions in the executed program. In this case, we start from ‘smain’ and pull in all the subroutines that we detect.
  • The edges between nodes indicate that a function call occurred between the two functions sometime during the execution; it could be once, it could be many times. The color of the edge is a slightly more saturated version of the color of the node that performed the call. If they call each other, only one color wins.
  • The rings around the outside of each node indicate when it was called, specifically:
    • The ring starts and stops based on the chronicle-query timestamp. Like on a clock, time starts at due north and flows around clock-wise, with the last smidge of time just before we reach due north again.  This has its ups and downs. The reason we are using ‘smain’ instead of ‘main’ is that when we used the untouched main, the first “new” ended up taking up most of our timestamp space. So I turned main into smain and had a new main that takes the memory allocator start-up cost hit and then calls smain.
    • The thickness of the ring indicates the depth of the call-stack at the time. The thickest ring corresponds to the outermost function, the thinnest ring to the innermost function. This results in a nice nesting effect for recursive functions, even if it’s more of an ‘indirect’ recursion.
    • The color of each ring slice is based on the control flow taken during the function call. (I think this is awesome, hence the bolding.) Now, I’m making it sound fancier than it is; as a hackish first pass, we simply determine the coverage of all the instructions executed during that function call. A more clever implementation might do something when iteration is detected. A better implementation would probably move the analysis into the chronicle-query core where information on the basic blocks under execution should be available. Specific examples you can look at above:
      • print_list: The outermost calls are aqua-green because their boolean arguments are true. The ‘middle’ calls are light green because their boolean arguments are false. The fina, innermost calls are orange-ish because they are the terminal case of the linked-list traversal where we realize we have a NULL pointer and should bail without calling printf. They are also really tiny because no printf means basically no timestamps for the function.
      • nuke: Four calls are made to nuke; the first and third times (light blue) we are asking to remove something that is not there, the second and fourth times (purple) we are asking to remove something that is. I have no idea why the third removal is so tiny; either I have a bug somewhere or using the timestamps is far more foolish than I thought.

Besides the obvious shout-out to chronicle-recorder, pygraphviz and graphviz power the graph layout. Now, a good question would be whether this actually works on something more complex? Could it be? Well, you can probably see the next picture as you’re reading this, so we’ll cut this rhetorical parade short.

visichron.py trace chronicle-query -f load_all_mmapped_objects

Besides the obvious font issues, this actually looks pretty nice. But what does it tell us? Honestly, the full traversal here is excessive. All we care about is the center node, load_all_mmapped_objects, and load_dwarf2_for (due north and a teeny bit east of the center node). If we look at the calls to load_dwarf2_for, we can see that two of them have different control-flow coverages. Those happen to be the times debug symbols could not be found (which is my problem I want to debug). The first one is for ld-2.6.1.so (I’m looking at the textual output of chronisole for the same command), and the second one is for /usr/bin/python2.5. The second one should definitely not fail, because it should find the symbols in /usr/lib/debug, but it does.

Unfortunately, the trail sorta stops cold there with a bug in either chronicle-query or in chroniquery (possibly cribbed from chronomancer). load_dwarf2_for should be calling dwarf2_load, but we don’t see it. I don’t know why, but I haven’t actually looked into it either. Rest assured that a much more awesome graph awaits me in the future!

Because there’s too much text and not enough pictures, I’ll also throw in the output of the ring visualization test which uses a stepped tick-count (1 per function call) to show how things could look if we went with an artificial time base…

ring visualization example

Bzr repositories for both can be found at http://www.visophyte.org/rev_control/bzr/.

Hooray for dwarf location lists!

chronisole-trace-fancy-main-working.png

I resolved the time-stamp issues from last time. Arguments are now happy because we move to the time-stamp corresponding to when the function’s prologue had completed. The booleans were wrong because they were copied to locals during the prologue, which is where the argument list referenced them. Things like this are much easier to diagnose thanks to support of disassembly prints-outs via the diStorm64 disassembler, although I may move to using libdisassemble in the future since it is pure python and presumably provides (or can be more easily coerced to provide) a richer set of info about the disassembly.

Chroniquery slightly more chronoriffic

So, I was playing with the fantastic Chronomancer (roc‘s announcement, project link), an Eclipse GUI for chronicle-recorder, using a trace from my PyXPCOM troubles. I discovered a lack of some symbols that seemed like they should be there and decided to then run chronicle against chronicle-query and view the problem in Chronomancer so that I might smite it. Unfortunately, some stuff didn’t show up in that trace, so I went investigating by way of enhancing chroniquery so that I might better understand the problem while also making chroniquery more usable. Sadly, there’s still more work to be done, but I have a picture to show and I understand a good deal of the chronomancer internals now and how to drive chronicle-query better.

chroniquery against fancy, tracing main, minor issues

The above is pretty representative of what chroniquery’s chronisole can now do. It’s an invocation of chronisole.py trace fancy -f main. The ‘fancy’ program builds a linked list using ‘cons’, uses the recursive ‘print_list’ to print the list, and uses the iterative ‘nuke’ to delete entries from the list. ‘cons’ returns the newly allocated list entry/cons cell, and nuke returns 0 if the entry existed and was nuked or 1 if it didn’t exist. We traced main because of the -f; we could start with any bunch of functions as the root, and can use -x to filter out noisy functions from the recursive function discovery. Return values and parameters are shown.

Of course, even in this example, the first/newline booleans are wrong, presumably indicative of some wackiness/off-by-one-error in my mechanism for determining the sub-called functions’ function entry timestamps. I’m confident I’m doing some foolish things, but it will have to wait until the weekend and a more well-rested brain. I’ve pushed the changes to the bzr tree if anyone wants to do my work for me.

Chroniquery: Chronicle-Recorder and Python Boogie Down

Robert O’Callahan‘s Chronicle-Recorder is one of the most exciting debugging tools to come down the road ever. In order to help me track down my PyXPCOM problem that has been a stumbling block to full Thunderbird integration, I’ve laid the groundwork for a nice Python-based interface to chronicle-query.

chronisole output on loopy

You can find it in a bzr repository at http://www.visophyte.org/rev_control/bzr/chroniquery/

It depends on some mods I’ve made to chronicle-recorder which can either be found in my (st)git repository (git-svnimport’ed) at http://www.visophyte.org/rev_control/git/chronicle-recorder.git/ on the acs-base branch. I have no idea how to have someone branch the repository and get stgit to actually understand the patches, so I have also exported the patches to http://www.visophyte.org/rev_control/patches/chronicle-recorder/. They should apply cleanly to rev 13/15 of the trunk. In a nutshell, the patches make things work with a somewhat-up-to-date Ubuntu gutsy (7.10) install, add the ability to retrieve information on compilation units including their memory offsets, add the ability to get source line information (with some overkill on determining the end of the current ‘line’), and a bugfix for negative line offsets.

It’s my understanding from roc’s blog that he’s been working on a proper debugger interface, so some of these patches may be redundant or otherwise rendered moot.

The picture above is a screenshot of Firefox rendering the styled HTML output of chronisole.py run against the loopy.c program in the chroniquery examples dir. (Click on the picture to go to the HTML.) It’s like a fibonacci generator, but it’s not. If you run chronisole in a terminal without the HTML args, it will output the equivalent, but you need to have a 256-color xterm. To summarize its actions, it finds all the compilation units residing in the executable which have low_pc/high_pc info and uses that as the basis of the ranges of interest for an instruction scan. It loops over the source-lines as they are executed in sequence, grabs the lines, and looks up the values of the locals just after the source line completes execution. If each local’s value differs or was not in the previously executed line’s locals, it gets to be yellow, otherwise it is a subtle color.