performance annotated SQLite EXPLAINation visualizations using systemtap

For the Thunderbird 3.1 release cycle we are not just fixing UX problems but also resolving various performance issues.  Building on my previous work on a visualization of SQLite opcode control flow graphs using graphviz I give you… the same thing!  But updated to more recent versions of SQLite and integrating performance information retrieved through the use of systemtap with utrace.

In this case we are using systemtap to extract the number of times each opcode is executed and the number of btree pages that are requested during the course of executing the opcode.  (We do not differentiate between cache hits and misses because we are looking at big-O right now.)  Because virtual tables (like those used by FTS3) result in nested SQLite queries and we do not care about analyzing the queries used by FTS3, we ignore nested calls and attribute all btree page accesses to the top-level opcode under execution.

Because the utility of a tool is just as dependent on ease of use as its feature set, I’ve cleaned things up and made it much easier to get information out of Thunderbird/gloda with this patch which should land soon and provides the following:

  • The gloda datastore will write a JSON file with the EXPLAINed results of all its SQL queries to the path found in the preference mailnews.database.global.datastore.explainToPath.  This preference is observed so that setting it during runtime will cause it to create the file and begin explaining all subequently created queries.  Clearing/changing the preference closes out the current file and potentially opens a new one.
  • Gloda unit tests will automatically set the preference to the value of the environment variable GLODA_DATASTORE_EXPLAIN_TO_PATH if set.
  • A schema dump is no longer required for meta-data because we just assume that you are using a SQLite DEBUG build that tells us everything we want to know about in the ‘comment’ column.
  • grokexplain.py now uses optparse and has more internal documentation and such.

So what do the pretty pictures show?

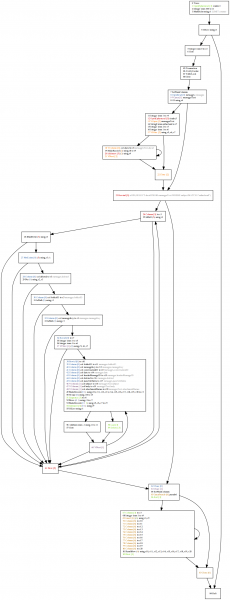
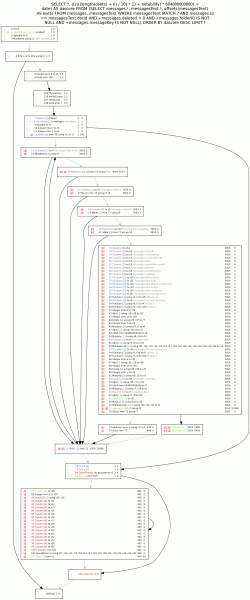
  • Before: A gloda fulltext query search retrieves all of the results data before applying the LIMIT.  This results in a lot more data transplanted into temporary results tables than we will end up using; wasted bookkeeping.  Additionally, we incur the row lookup costs for both our messages data storage table and our fulltext messagesText table for all hits, even the ones we will not return.  (Noting that there was no escaping hitting both tables since we were using offsets() and it hits the fulltext table as part of its operation.)
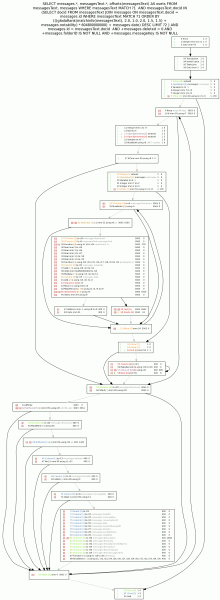
  • After: We perform an initial query phase where we minimize wasted bookkeeping by only retrieving and using the bare minimum required to compute the LIMITed list of document id’s.  Additionally, by use of the FTS3 matchinfo() function instead of the offsets() function we are able to avoid performing row lookup on the messagesText table for results that will not be returned to the user.  Use of the matchinfo() function requires a custom ranking function which allows us to be somewhat more clever about boosting results based on fulltext matches too.
  • The poor man’s bar graphs in the pictures are expressing a hand-rolled logarithmic scale for the number of invocations (left bar) and number of btree pages accessed (right bar).  On the right side of each line the actual numbers are also presented in the same order.  The goal is not to convey good/bad so much as to draw the eye to hot spots.

Notes for people who want more to read:

  • SQLite has built-in infrastructure to track the number of times an opcode is executed as well as the wall-clock time used; you do not have to use systemtap.  It’s a conditional compilation kind of thing, just -DVDBE_PROFILE and every statement you execute gets its performance data appended to vdbe_profile.out when you reset the statement.  It doesn’t do the btree pages consulted trick, but it’s obviously within its power with some code changes.
  • Our use of systemtap is primarily a question of discretionary reporting control, the ability to integrate the analysis across other abstraction layers, and various build concerns.  The JSON output is not a driving concern, just something nice we are able to do for ourselves since we are formatting the output.
  • The tool has really crossed over into the super-win-payoff category with this fix investigation.  (Having said that, I probably could have skipped some of the data-flow stuff last time around.  But these projects are both for personal interest and amusement as well as practical benefit, so what are you gonna do?  Also, that effort could pay off a bit more by propagating comments along register uses so that the LIMIT counter register r8 and the compute-once r7 in the after diagram would not require human thought.)

References:

  • The grokexplain repo.  Used like so: python grokexplain.py –vdbe-stats=/tmp/glodaNewSearchPerf.json /tmp/glodaNewSearchExplained.json -o /tmp/glodasearch-newcheck
  • The systemtap script in its repo.  Used like so: sudo stap -DMAXSTRINGLEN=1024 sqlite-perf.stp /path/to/thunderbird-objdir/mozilla/dist/lib/libsqlite3.so > /tmp/glodaNewSearchPerf.json
  • The bug with the gloda explain logic patch and the improved SQL query logic.  I also used the tooling to fix another (now-fixed) bug, but that problem turned out to be less interesting.

visualization of control-flow/data-flow analysis of sqlite EXPLAIN-ations

control-flow before

control-flow before

While doing some work on the gloda-based search targeted for beta 2, I came upon some query slowness and decided to look into it.  Because gloda queries are (conceptually, at least) dynamic, we also generate dynamic SQL.  Our schema is fairly normalized, and it’s not always obvious to me what I can expect to have going on.  EXPLAIN QUERY PLAN is a good litmus test for massive insanity, but it’s a bit concise.  For example, the troublesome SQL was as follows:

SELECT * FROM messages INNER JOIN messagesText ON messages.id = messagesText.rowid WHERE id IN (SELECT docid FROM messagesText WHERE subject MATCH "sutherland") AND deleted = 0 AND folderID IS NOT NULL AND messageKey IS NOT NULL ORDER BY date DESC LIMIT 100;

This nets us:

0|0|TABLE messages WITH INDEX deleted
1|1|TABLE messagesText VIRTUAL TABLE INDEX 1:
0|0|TABLE messagesText VIRTUAL TABLE INDEX 2:

Everything’s an index!  We win!  Sorta.  The index it chose is somewhat worrying if you think about it.  But really, it’s all quite nebulous.  I have basically no idea what is happening in there.  The good news is that EXPLAIN will tell us the actual opcodes in use.  The bad news is that it is quite hard to understand (104 opcodes), at least for this query.

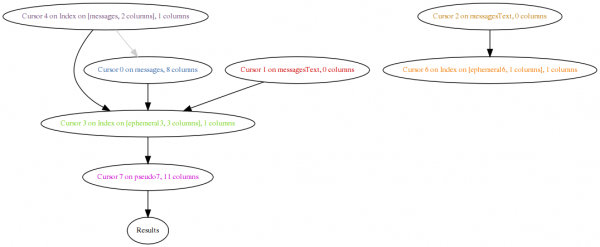
Python, graphviz, pygraphviz, and compulsive tool-building to the rescue!  My original plan was that data-flow analysis could make everything incredibly obvious as to what is going on.  I’m not sure I reached that point.  But in the process, the efforts required to make the system clever enough to do data analysis allow the control flow diagram to be quite pretty and have lots of useful information.  The main sign of data-flow analysis is that all cursor write operations have the list of cursors that data flowed from in parens.  Each cursor gets its own tango-ish color, and opcodes involving the cursor are colored by that cursor.

The major flaw in the data-flow analysis that springs to mind right now is that it ignores control flow.  An action that will only be taken because of a control-flow decision based on data retrieved from a cursor should ideally establish a relationship.  This is important because gloda throws around a lot of set intersections (although not in this case) in its queries, and it would be nice to be able to concisely express that.  The control-flow diagram is arguably orders of magnitude better than a raw EXPLAIN, but my hope is/was that the data analysis can make it trivial to figure out how things are being hooked up.  Given the amount of effort already expended and the present results, I figure I’m probably at the “control flow is good enough for the foreseeable future stage of things”.

In any event, the control-flow graph makes it (more) obvious that the outer loop is using the ‘deleted’ index to walk over *every deleted message in the database*.  A one-off idiom computes the full-text search and stashes it in an intermediary table.  As we then walk over every deleted message, we see if that message can be found in the full-text search result table.  If it is, our previously queued lazy-seek against the main messages table happens and we search against the full-text table to do our join.  And out pop results!

My hope for this query was that the deleted condition would be executed as a constraint as we were walking our result set, just like the folderID and messageKey constraints.  Making sure your queries are using the right index and helping the optimizer make the right call is a fairly textbook problem and the SQLite docs are actually pretty good on this.  For the sake of the example, I have dropped the index entirely.  (The ‘deleted’ index was added so we can quickly mark messages as needing deletion processing without slowing down deletes for the user.  It may turn out to be more beneficial to leave the field as-is, but use a separate table as our work queue.)

dataflow before

dataflow before

control-flow after

control-flow after

After the deletion, we get the revised diagram.  The full-text search still happens completely before we produce any other results, but this is keeping in keeping with our query.  (The query generation code is designed to handle the case where we have multiple constraints and must intersect the results of each.  It can clearly be optimized for the case where no primary-key intersection is required.)  The traversal of the full-text search result set is now the outer loop.  Deleted is now just filtering like folderID and messageKey, as expected.

The major lingering red flag is the block that calls Last() and Delete().  The conditional that makes the decision to do that is using “r1”, which is apparently implementing our limit logic inside the code.  This was confusing until I remembered that we’ve got an ORDER BY going on.  The Delete is just culling the results that will never potentially be seen.  The bad news is that we are doing our full-text search join prior to the ORDER BY culling.  So, my original fear that we are doing the JOIN no matter what still holds.  And that’s enough excitement for one day.

Given that any full-text search with ordered results will require retrieval the entire result set and correlating it against at least one table, I’m tempted to create separate tables for different windows of time given the importance of recency.  Thoughts/input appreciated, as anyone who has read this far is probably very detail oriented…

UPDATE (Feb 25, 2009): The hg repo is http://hg.mozilla.org/users/bugmail_asutherland.org/grokexplain/.  It now does some actual value propagation (and has had various bugs fixed).  By default it ignores ‘Yield’ because the way in which they are used (basically generator/continuation) wreaks havoc on the CFG with just straightforward static analysis.  If you want the yields, pass “yields” on the command line.  Also, passing “debug” gets you the states of the registers at the entrance/exit of the “basic blocks”.  (Not technically basic blocks, but close enough for my purposes.)