about:nosy can now show CPU usage using jsprobes

Refresher: about:nosy was introduced one week ago as a way to see the memory usage of your tabs and extensions (that live in compartments).  It sorta looked like this:

Except those (green) bars on the right are new.  The ones on the left, they show memory.  The ones on the right, they show CPU usage.  New data points enter on the left, surf across to the right, then fall into oblivion.  I have it on good authority that researchers are looking into some way of labeling these things so that you don’t have to read a blog post to understand them.  But until they do, I have a blogging gig, so let’s hope it takes them a bit longer.

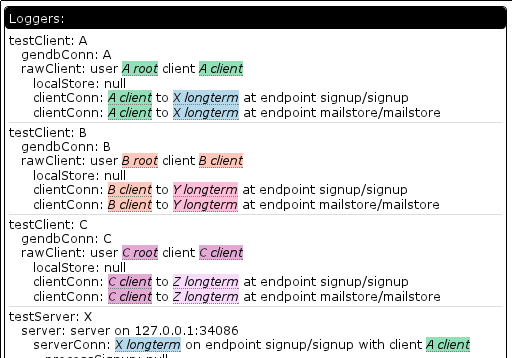
The above is a picture of the bars belonging to a tab viewing a Mozilla Demo Studio demo by ybochatay https://developer.mozilla.org/en-US/demos/detail/animation-of-weather-fronts/launch.  What’s really neat about this example is that you can see it was going to town on the CPU in the past (right; past), then usage fell off a cliff.  Why?  Because I changed from that tab to the about:nosy tab.  I’m going to assume that’s Firefox’s setTimeout/setInterval throttling of background tabs was at work and the team is to be congratulated for that.  If it’s the case that the demo or the demo framework is very responsible, kudos to those involved parties.

We track CPU utilization on a per-compartment basis, taking care to only attribute usage to a single compartment per thread at a time.  In the event of ill-behaved parties spinning a nested event loop, we are not currently clever enough to stop the clock in this implementation.  Native code costs like reflows that are incurred with the JS still on the stack will happily be attributed to the compartment.

The magic that powers the CPU tracking is Brian Burg‘s jsprobes implementation.  See his blog post and master probe hacker (ETW!) Steve Fink‘s blog post on its magical powers.

If you are adventurous…

…you can build your own Firefox build with jsprobes.  The patch series to use is my updated fork found here on bitbucket.  You’ll want to build with “ac_add_options –enable-jsprobes”.  The one non-jsprobes change in there is to cause all XPConnect memory reporters to provide the address of their compartment just like system compartments do.  Doing so allows us to correlate compartment CPU usage to the compartment’s memory reporter information without going crazy.

You can verify things work by trying out about:jsprobes, a simple extension you can hack on to play with probes.  You can also check out the Steve Fink created/Brian Burg jsprobes-enabled* about:gc implementation which provides us with the screenshots in the immediate vicinity of this sentence.  I’m not sure what those squiggly things on the left and the bottom of the boxes filled with pretty lines and dots are; I’ll see if I can find a blog post explaining them.

Or you can grab the source for about:nosy.

* I think this is the attribution breakdown based on my own inference; I could be wrong.  Either way, they’re both awesome.

If you are not adventurous…

…I will hopefully spin some try builds in the near future.  Wait for those.  Right now about:nosy still has unacceptable levels of performance impact on your session once you get a bunch of tabs so the custom builds would be one-off novelty uses for 30 seconds.

But while you wait, maybe you would like to peruse the probes that power the CPU monitoring?

In closing?

It’s worth noting that there are other viable ways to track compartment CPU usage, but jsprobes are the funnest.

about:nosy is about:memory with charts, helps you lay blame more easily

about:memory and the memory reporter infrastructure that powers it are amazing.  They provide an explicit hierarchy that breaks down the memory use in the system to the subsystems and increasingly the causes of allocation.  about:memory looks like this (if you stand a few feet back from your monitor and take off your glasses):

If you are going to look at about:memory, it is probably for one of two reasons:

  1. You are Nicholas Nethercote or one of his merry band of MemShrink hackers kicking ass and taking names (of inefficient uses of memory).  In this case, about:memory is exactly what you need.
  2. You suspect some tab in Firefox has gone crazy and you want to figure out which one it is and take your vengeance upon it.  Vengeance can take the form of thinking mean thoughts, closing the tab, or writing a snarky tweet.  about:memory will let you do this, but you have to look at a lot of text and you may already be too late to find the culprit!  If only there was an easier way…

Enter about:nosy:

It can show us a list of all the open tabs and their memory usage sans JS for now, as per the above screenshot.  If you expand the tab capsules, you get to see the list of all the inner windows/iframes that live in the hierarchy of that page.  In most cases the list is either really short and boring or really long and boring.  In the case of www.cnn.com I end up with 26 inner windows.

It can also show us memory aggregated by origin.  We do show JS for this case because JS is currently only trackable on a per-origin basis.  When Bug 650353 gets fixed or the memory reporters get more specific we should be able to apportion JS usage to pages directly.

It also attempts to aggregate extension JS compartments back to their owning extension.  We ask the add-on manager for a list of the installed extensions to find their filesystem roots, ask the resource protocol to explain resource mappings, and from there are able to translate such paths.  Just keep in mind that traditional overlay-based extensions do not create their own compartments and so are invisible for tracking purposes.

In the screenshot above, you can see that about:nosy keeps the charts exciting by generating a ridiculous amount of garbage all by itself.  Much of this is just the about:memory tree-building code that we are reusing.  If you refreshed about:memory once a second you would probably see similar garbage creation from the main system JS compartment.

You can install a restartless XPI (update: points at 0.3 now which does not screw up style shell apportionment and uses a better add-on SDK that does not create throwaway JS compartments every second) of the state of the now that will not auto-update.  It wants a recent nightly build of Firefox because it makes assumptions about the structure of the memory reporters in order to better serve you.

You can find the source repo on github.  It requires the add-on SDK to build.  It might seem a little overkill for just graphing memory history, but if you’re looking at the repo you will notice my goal is to use Brian Burg‘s jsprobes work aided by Steve Fink and now de-bitrotted by me (but still a bit crashy) to be able to graph CPU usage, including raw JS, layout/reflow, and paint (eventually, after adding probe points).  It’s also possible for those statistics to be gathered via static mechanisms, but the probes are fun and I want to see them work.

The joy of integrated logging and log viewing with fancy logs

The deuxdrop messaging experiment‘s current incarnation exists as an (under development) Jetpack that runs in Firefox.  I am still trying to shake out functionality to be driven by the UI rather than headless unit tests.  While firebug has been a great help, another boon has been the logging framework and log viewing framework developed for the unit tests.  (Previous posts here and here).  Since the log is made up of structured JSON data, all the log processing logic is written in JS, and the log viewing UI is HTML/CSS/JS, it is trivial to embed the log viewer into the Jetpack itself.

If you type about:loggest in the URL bar (or better yet, create a bookmark on the bookmark bar and click that), the log viewer is displayed.  Deuxdrop’s client daemon logic (which runs in a hidden frame), uses a log reaper that runs at 1-second intervals.  If anything happens log-wise during that second, it is packaged and added to a circular-buffer style list of the last 60 seconds where anything happened.  When the log viewer starts up, it asks for and receives the data.  The result looks like the above small screenshot.  If no errors were logged during the time interval, it is automatically collapsed.

Let us experience the joy of integrated logging by looking at a real problem I recently encountered.  In the development UI (accessible via about:dddev), I brought up a list of my contacts after starting a conversation.  It looks like this right now:

The problem is that I, the user, am “Andrew Sutherland” and should not be in my own contact list.  Also, the display should not be claiming there are an undefined number of unread messages from me, but that is likely fallout from the system intentionally not maintaining such information about me, the user.

I want to quickly figure out why this is happening, so I bring up about:loggest and open the most recent time entry to see what happened when this query was issued and filled:

I can see that the query ended up issuing database requests for both Walternate (purple) and myself (green), strongly suggesting that the database index being queried on names me.

I wonder if the conversation processing logic was the code that did this… let’s check by going to the time slice where the conversation was processed, expanding it, and only screenshotting some of it:

Yes, the conversation logic did this.  It’s generating index values in the peepData table for the idxPeepAny and idxPeepRecip indices.  But I thought my unit tests covered this?  Nope.  It turns that although we test that a peep query returns the right thing both cold from the database and inductively via notifications as contact relationships are established, we don’t issue a new query after creating a conversation.  Furthermore, we only issued queries against the alphabetical index, not against idxPeepAny.  So we rectify that by augmenting the unit test:

  // - make sure that the conversation addition did not screw up our peeps list
  T.group('check peeps list after conversation join');
  lqFinalAllPeeps = moda_a.do_queryPeeps("allPeepsFinal:any", {by: 'any'});

And the test indeed now fails:

The relevant bit is in the lower right, which I blow up here with the “unexpected event” obj popup displayed above it, and the “failed expectation” obj popup below it.  The postAnno stuff is to indicate what is new in the query result.  Because it’s a freshly issued query and this is the first set of results, everything is new.  It’s probably worth noting that these errors would usually show up as a single “mismatched” error instead of an unexpected/failed pair in our tests, but the specific logger was operating in unordered set mode because we don’t care about the exact order that different query notifications occur in, we just care that they do occur.

(The structure is intended to later be enhanced to provide a nicer visualization where we only show the contents of the “state” attribute and use preAnno to indicate annotations on a representation of the most recent state for the object (from a previous log entry) and postAnno to indicate annotations on the now-current representation “state”.  For postAnno, values of 1 represent an addition, and values of 0 represent a change or event firing on the object.)

A potentially even more exciting bit of integrated logging is that about:loggest-server opens a tab that retrieves its contents from the server.  When run with the –loggest-web-debug flag, the server loads a module that cranks up the logging and does the same 1-second interval log reaping magic and exposes it for HTTP retrieval.  While this specific configuration with the high level of detailed logging is only appropriate for a developer-machine test server, it is incredibly valuable to be able to just pop open another tab and see what the server just got up to.

In any event, I leave it as an exercise to the reader to assume that I will take care of the bug now that it’s extremely clear what the problem is.  Well, extremely clear if I had taken a bigger screenshot of the conversation creation log.  Above the region captured is a header that indicates the actions are being triggered by the ‘convJoin’ task and the entry (which is visible) indicates the update_conv_data function likely kicked off the database activity.

PS: All the gibberish looking characters in the screenshots are crypto keys or other binary data that lack aliases mapping them to known objects.  Examples of successfully mapped aliases are the colored blocks.  In the case of the conversation creation gibberish, we are seeing the conversation id.  Those aliases are generated as a separate pass by the log reaper by walking the set of existing queries and using helper functions to map the items currently exposed by the queries to human names because it’s quick and easy and is O(what’s being looked at) not O(size of the database).  In the case of the conversation, there was no query against the conversation and I also have not written the helper function yet, which is why it did not get aliased.  Unit tests don’t have the problem because we create aliases for everything.

overview ownership/communication graphs for rich execution logs

relationship-overview-spgm

My last blog post covered the fancy pants logging being used for the deuxdrop project.  To summarize:

  • we have loggers
  • they are organized by ownership hierarchy
  • they provide sufficient metadata that we can reconstruct the loggers that were talking to each other
This can result in a lot of loggers.  If you look at the log output from the last blog post (caution: BIG JSON file in standalone ArbPL instance) you might notice a list of loggers that looks something like the below, except not quite as sideways or shrunk:

last generation's logger hierarchy rotated sideways

Obviously, that much raw data is not super helpful.  So now we process the hierarchy, constructing graph nodes or aggregate graph nodes for things that are interesting in their own or in aggregate.  We use d3 of the vaunted protovis lineage to visualize the network and graphviz to lay it out.

d3 has a super-polished, fun-to-use interactive force-directed graph implementation, but graphviz’s circo layout produces better results.  Given that ArbPL already has a processing step for intake, it wasn’t too much extra work to include a step where we use the same JS code as on the client to generate a dot file, pass it to circo to lay it out, then extract the layout information and store it with the log data.  Many props to Gregoire Lejeune for his node-graphviz bindings that made it so easy to do.

overview-z-joined-notif-highlighted

Although the overview graph on its own is neat, it becomes useful by showing us the involved loggers/actors in a test step by highlighting them.  It does this by listening for wmsy‘s focus change events to know what the focused test step is.  (Since mouse interaction also causes toggling, it’s easiest to appreciate the process by using the up/down arrow keys to change focus without expanding the steps.  And if you want to toggle the expanded state without involving the mouse, you can hit the enter key.)

z-joined-step-callout-causes-highlighting

For reference, the steps look like the above, and the highlighted one has the ever-so-fashionable glowing fancy focus ring.

If you would like to see this for yourself, you can check out the archived (and therefore less likely to break) standalone version of the example log file: https://clicky.visophyte.org/examples/arbpl-loggest/20110720/.  The previously super-huge JSON file is now about an order-of-magnitude smaller because I started eliding large strings that are of no human interest.

new adventures in rich (execution) logs for debugging and program understanding

Understanding what is going on inside software can be very hard, even for the developers most familiar with the software.  During my time working on Thunderbird I used a variety of techniques to try and peer inside: printf/dump/console.log, debuggers, execution analysis (dtrace, chronicle recorder, with object diffs, on timelines), logging (log4j style, with  timelines, with rich data, extra instrumentation and custom presentations, prettier and hooked up to dump on test failures), improving platform error reporting, gdb extensions, control-flow analysis of SQL queries (vanilla, augmented with systemtap perf probes), performance analysis (VProbes with custom UI, systemtap, crammed into the SpeedTracer UI, custom UI with the async work), chewing existing log facilities’ output (TB IMAPgecko layout), and asynchronous operation causality reconstruction (systemtap, JS promises).

Logging with rich, structured data easily provided the most bang-for-the-buck because it:

  1. Provided the benefit of baked-in human meaning with some degree of semantic hierarchy.
  2. Was less likely to make wrong assumptions about what data was relevant.  How many times have you had to go back to change what a printf is logging?
  3. Once sufficiently automated, required no activation energy, no extra steps, and everyone can see the results.
However, it still has numerous downsides/gotchas:
  1. Potential performance impact, especially with rich, structured data.
  2. If people don’t write log statements, you don’t get log entries.
  3. If an error propagates and no one catches it or otherwise says anything about it, your log trace stops dead.
  4. Lack of context can hide causation and leave you filtering through tons of entries trying to reconstruct what happened from shadows on the cave wall.


As a result, when I recently started on a new project (implemented in JS), I tried to make sure to bake logging into the system from the ground up:
  • The core classes, abstractions, and APIs generate log entries automatically so developers don’t need to fill their code with boilerplate.
  • Loggers are built around object ownership hierarchies/life-cycles to provide context and the ability to filter.  This is in contrast to log4j style logging which is usually organized around code module hierarchies, noting that log4j does provide nested diagnostic contexts.
  • The test framework is designed around writing tests in terms of expectations around the loggers.  This helps ensure interesting things get logged.  It also improves the quality of the tests by making it easier to ensure the tests are really doing what you think they are doing.
  • Logger definitions explicitly name the log events they will generate and their semantic type, some of which have special handling.  The currently supported types are: state changes, latched states, events, asynchronous jobs (with separate begin and end entries), calls (which wrap a function call, catching exceptions), and errors.  This allows specialized processing and better automated analysis without having to try and reverse engineer the meaning using regular expressions.
  • Performance is addressed by instantiating different logger classes based on needs.  For modules not under test (or without logging desired), everything turns into no-ops except for events and errors which are counted for reporting to a time-series database for system health/performance/etc analysis.  The decision making process happens at runtime and is able to see the parent logger, so heavy-weight logging can be used on a statistical sampling basis or only for specific users experiencing problems/etc.
  • Loggers can give themselves complex semantic names that can be used to reconstruct relationships between loggers when the ownership hierarchy is not available or not appropriate.  For example, we can link both sides of the connection between a client and a server by having the loggers make sure to name themselves and the other side.
  • Simple wrapper helpers exist that make it easy to wrap a function so that a custom log entry is generated and it “holds” the call in limbo from whence it can later be “released”.  This allows unit tests to break complicated behaviour into discrete steps that humans can understand.  Far better to look at one thing at a time than eight things all jumbled together (or filtered back down to one, potentially hiding important details).


In any event, as one might surmise from the screenshots, this is more than a dream, it’s a pastel colored reality.

What are the screenshots showing?

  1. The logger hierarchy.  The colored bits are “named things”.  The test framework has the concept of things, actors, and loggers.  Each actor corresponds to exactly one logger and is the object on which tests specify their expectations.  Actors can be owned by other actors, resulting in a hierarchy we call a family.  Each family gets tagged with a distinct identifier that allows us to associate a color with them.  Things provide a human name to a (hopefully) unique string.  Things can be owned by actors and get tagged with the family name and so can be colorized.  In the logger hierarchy, the stuff to the right of the colon is the semantic name of the logger.  So “clientConn: A client to X longtermat endpoint blah” is really (under the hood) an array of strings where “A client” is actually the crypto key so named.  There are two colors because the connection is naming both its own identifying crypto key and the server’s crypto key it is trying to talk to.
  2. An example of the display of log entries.  Each logger gets its own column to display its entries in.  The header shows the name of the logger and is colored based on that logger’s family.  The colors were not shown in the logger hierarchy because I think it would end up too busy.  Each entry is timestamped with the number of milliseconds since the start of the test.  The event names are arbitrarily in blue to help delineate them from other semantic classes.  For example, “handleMsg” is a call-type.  The “obj” bits with the dotted stuff under it means something we can click on to see more of.  The events being shown are part of a CurveCP-style connection establishment.
  3. Similar to the previous screenshot, but here you can see named thing resolution in play with arguments that are strings.
  4. And if we click on one of those “obj” bits, we get a nice nested table display of the object.  As you can see from the pretty colors, named thing resolution is also in play.  You can also see crypto keys I did not name and which accordingly look like gibberish.  It is probably worth noting that some developer participation is required to make sure to put toJSON() implementations on all the complex objects that are exposed to the logger to make sure we don’t try and serialize huge swathes of object graph.  While this is a “don’t break the system” requirement, it also makes it easy to expose the useful bits of information for debugging.

If you would like to see the actual log display UI for yourself on the log from the screenshots (and can stomach it fetching 2+ MiB of compressed JSON), you can see it at https://clicky.visophyte.org/examples/arbpl-loggest/20110712/.  While the logs normally live on the ArbitraryPushlog (ArbPL) server, links to it are currently not stable because its all-in-one hbase datastore keeps self-destructing.  I baked ArbPL into a standalone form that lives at that URL and so should ideally not break so much.  Fingers-crossed.

logsploder, circa a year+ ago

Whoops.  I posted to mozilla.dev.apps.thunderbird about an updated version of logsploder at the end of 2009, but forgot to blog about it.  I do so now (briefly) for my own retrospective interest and those who like cropped screenshots.

The gloda (global database) tests and various Thunderbird mozmill tests have been augmented for some time (1+ years) to support rich logging where handlers are given the chance to extract the salient attributes of objects and convert them to JSON for marshaling.  Additionally, when the fancy logging mode is enabled, additional loggers are registered (like Thunderbird’s nsIMsgFolderListener) to provide additional context for what is going on around testing operations.

For a given test (file) run, logsploder provides an overview in the form of a hierarchical treemap that identifies the logger categories used in the test and a small multiples timeline display that characterizes the volume of messages logged to each category in a given time slice using the treemap’s layout.  The idea is that you can see at a glance the subsystems active for each time-slice.

Logsploder can retain multiple test file runs in memory:

And knows the tests and sub-tests run in each test file (xpcshell) run.  Tests/sub-tests are not green/red coded because xpcshell tests give up as soon as the first failure is encountered so there is no real point:

Clicking on a test/subtest automatically selects the first time slice during which it was active.

Selecting a time-slice presents us with a simple list of the events that occurred during that time slice.  Each event is colored (although I think darkened?) based on its logging category:

Underlined things are rich object representations that can be clicked on to show additional details.  For example, if we click on the very first underlined thing, “MsgHdr: imap://user@localhost/gabba13#1” entry, we get:

And if we click on the interestingProperties OBJECT:

Logsploder was a pre-wmsy (the widget framework that I’ll be talking about more starting a few weeks from now) tool whose UI implementation informed wmsy.  Which is to say, the need to switch to a different tab or click on the “OBJECT” rather than supporting some more clever form of popups and/or inline nesting was a presentation limitation that would not happen today.  (More significantly, the log events would not be paged based on time slice with wmsy, although that limitation is not as obvious from the way I’ve presented the screenshots.)

If anyone in the Thunderbird world is interested in giving logsploder a spin for themselves, the hg repo is here.  I also have various patches that I can cleanup/make available in my patch queue to support logging xpcshell output to disk (rather than just the network), hooking up the logHelper mechanism so it reports data to mozmill over jsbridge, and (likely heavily bit-rotted) mozmill patches to report those JSON blobs to a CouchDB server (along with screenshots taken when failures occur).  The latter stuff never hit the repo because of the previously mentioned lack of a couchdb instance to actually push the results to.  Much of the logHelper/CouchDB work will likely find new life as we move forward with a wmsy-fied Thunderbird Air experiment.

Many thanks to sid0 who has continued to improve logHelper, if sometimes only to stop it from throwing exceptions on newly logged things that its heuristics fatally did not understand 🙂

Visualizing asynchronous JavaScript promises (Q-style Promises/B)

Asynchronous JS can be unwieldy and confusing.  Specifically, callbacks can be unwieldy, especially when you introduce error handling and start chaining asynchronous operations.  So, people frequently turn to something like Python’s Twisted‘s deferreds which provide for explicit error handling and the ability for ‘callbacks’ to return yet another asynchronous operation.

In CommonJS-land, there are proposals for deferred-ish promises.  In a dangerously concise nutshell, these are:

  • Promises/A: promises have a then(callback, errback) method.
  • Promises/B: the promises module has a when(value, callback, errback) helper function.

I am in the Promises/B camp because the when construct lets you not care whether value is actually a promise or not both now and in the future.  The bad news about Promises/B is that:

  • It is currently not duck typable (but there is a mailing list proposal to support unification that I am all for) and so really only works if you have exactly one promises module in your application.
  • The implementation will make your brain implode-then-explode because it is architected for safety and to support transparent remoting.

To elaborate on the (elegant) complexity, it uses a message-passing idiom where you send your “when” request to the promise which is then responsible for actually executing your callback or error back.  So if value is actually a value, it just invokes your callback on the value.  If value was a promise, it queues your callback until the promise is resolved.  If value was a rejection, it invokes your rejection handler.  When a callback returns a new promise, any “when”s that were targeted at the associated promise end up retargeted to the newly returned promise.  The bad debugging news is that almost every message-transmission step is forward()ed into a subsequent turn of the event loop which results in debuggers losing a lot of context.  (Although anything that maintains linkages between the code that created a timer and the fired timer event or other causal chaining at least has a fighting chance.)

In short, promises make things more manageable, but they don’t really make things less confusing, at least not without a little help.  Some time ago I created a modified version of Kris Kowal‘s Q library implementation that:

  • Allows you to describe what a promise actually represents using human words.
  • Tracks relationships between promises (or allows you to describe them) so that you can know all of the promises that a given promise depends/depended on.
  • Completely abandons the security/safety stuff that kept promises isolated.

The end goal was to support debugging/understanding of code that uses promises by converting that data into something usable like a visualization.  I’ve done this now, applying it to jstut’s (soon-to-be-formerly narscribblus’) load process to help understand what work is actually being done.  If you are somehow using jstut trunk, you can invoke document.jstutVisualizeDocLoad(/* show boring? */ false) from your JS console and see such a graph in all its majesty for your currently loaded document.

The first screenshot (show boring = true) is of a case where a parse failure of the root document occurred and we display a friendly parse error screen.  The second screenshot (show boring = false) is the top bit of the successful presentation of the same document where I have not arbitrarily deleted a syntactically important line.

A basic description of the visualization:

  • It’s a hierarchical protovis indented tree.  The children of a node are the promises it depended on.  A promise that depended in parallel(-ish) on multiple promises will have multiple children.  The special case is that if we had a “when” W depending on promise X, and X was resolved with promise Y, then W gets retargeted to Y.  This is represented in the visualization as W having children X and Y, but with Y having a triangle icon instead of a circle in order to differentiate from W having depended on X and Y in parallel from the get-go.
  • The poor man’s timeline on the right-hand side shows the time-span between when the promise was created and when it was resolved.  It is not showing how long the callback function took to run, although it will fall strictly within the shown time-span.  Time-bar widths are lower bounded at 1 pixel, so the duration of something 1-pixel wide is not representative of anything other than position.
  • Nodes are green if they were resolved, yellow if they were never resolved, red if they were rejected.  Nodes are gray if the node and its dependencies were already shown elsewhere in the graph; dependencies are not shown in such a case.  This reduces redundancy in the visualization while still expressing actual dependencies.
  • Timelines are green if the promise was resolved, maroon if it was never resolved or rejected.  If the timeline is never resolved, it goes all the way to the right edge.
  • Boring nodes are elided when so configured; their interesting children spliced in in their place.  A node is boring if its “what” description starts with “auto:” or “boring:”.  The when() logic automatically annotates an “auto:functionName” if the callback function has a name.

You can find pwomise.js and pwomise-vis.js in the narscribblus/jstut repo.  It’s called pwomise not to be adorable but rather to make it clear that it’s not promise.js.  I have added various comments to pwomise.js that may aid in understanding.  Sometime soon I will update my demo setup on clicky.visophyte.org so that all can partake.

wmsy’s debug UI’s decision tree visualizer

wmsy, the Widget Manifesting SYstem, figures out what widget to display by having widgets specify the constraints for situations in which they are applicable.  (Yes, this is an outgrowth of an earlier life involving multiple dispatch.)  Code that wants to bind an object into a widget provides the static, unchanging context/constraints at definition time and then presents the actual object to be bound at (surprise!) widget bind time.

This is realized by building a decision tree of sorts out of our pool of constraints.  Logical inconsistencies are “avoided” by optionally specifying an explicit prioritization of attributes to split on, taking us much closer to (rather constrained) multiple dispatch.  For efficiency, all those static constraints are used to perform partial traversal of the decision tree ahead of time so that the determination of which widget factory to use at bind time ideally only needs to evaluate the things that can actually vary.

When I conceived of this strategy, I asserted to myself that the complexity of understanding what goes wrong could be mitigated by providing a visualization / exploration tool for the built decision tree along with other Debug UI features.  In software development this usually jinxes things, but I’m happy to say not in this specific case.

In any event, wmsy’s debug UI now has its first feature.  A visualization of the current widget factory decision tree.  Grey nodes are branch nodes, yellow nodes are check nodes (no branching, just verifying that all constraints that were not already checked by branch nodes are correct), and green nodes are result nodes.  Nodes stroked in purple have a partial traversal pointing at them and the stroke width is a function of the number of such partials.  The highly dashed labels for the (green) result nodes are the fully namespaced widget names.  Future work will be to cause clicking on them to bring up details on the widget and/or jump to the widget source in-document using skywriter or in an external text editor (via extension).

The Debug UI can be accessed in any document using wmsy by bringing up your debugger console and typing “document.wmsyDebugUI()”.  This triggers a dynamic load of the UI code (hooray RequireJS!) which then does its thing.  Major props to the protovis visualization toolkit and its built-in partition layout that made creating the graph quite easy.

fighting oranges with systemtap probes, latency fighting; step 2

Recap from step 1: Sometimes unit test failures on the mozilla tinderboxen are (allegedly, per me) due to insufficiently constrained asynchronous processes.  Sometimes the tests time out because of the asynchronous ordering thing, sometimes it’s just because they’re slow.  Systemtap is awesome.  Using systemtap we can get exciting debug output in JSON form which we can use to fight the aforementioned things.

Advances in bullet point technology have given us the following new features:

  • Integration of latencytap by William Cohen.  Latencytap is a sytemtap script that figures out why your thread/process started blocking.  It uses kernel probes to notice when the task gets activated/deactivated which tells us how long it was asleep.  It performs a kernel backtrace and uses a reasonably extensive built-in knowledge base to figure out the best explanation for why it decided to block.  This gets us not only fsync() but memory allocation internals and other neat stuff too.
    • We ignore everything less than a microsecond because that’s what latencytap already did by virtue of dealing in microseconds and it seems like a good idea.  (We use nanoseconds, though, so we will filter out slightly more because it’s not just quantization-derived.)
    • We get JS backtraces where available for anything longer than 0.1 ms.
  • The visualization is now based off of wall time by default.
  • Visualization of the latency and GC activities on the visualization in the UI.
  • Automated summarization of latency including aggregation of JS call stacks.
  • The new UI bits drove and benefit from various wmsy improvements and cleanup.  Many thanks to my co-worker James Burke for helping me with a number of design decisions there.
  • The systemtap probe compilation non-determinism bug mentioned last time is not gone yet, but thanks to the friendly and responsive systemtap developers, it will be gone soon!

Using these new and improved bullet points we were able to look at one of the tests that seemed to be intermittently timing out (the bug) for legitimate reasons of slowness.  And recently, not just that one test, but many of its friends using the same test infrastructure (asyncTestUtils).

So if you look at the top visualization, you will see lots of reds and pinks; it’s like a trip to Arizona but without all of the tour buses.  Those are all our fsyncs.  How many fsyncs?  This many fsyncs:

Why so many fsyncs?

Oh dear, someone must have snuck into messageInjection.js when I was not looking!  (Note: comment made for comedic purposes; all the blame is mine, although I have several high quality excuses up my sleeve if required.)

What would happen if we change the underlying C++ class to support batching semantics and the injection logic to use it?

Nice.

NB: No, I don’t know exactly what the lock contention is.  The label might be misleading since it is based on sys_futex/do_futex being on the stack rather than the syscall.  Since they only show up on one thread but the latencytap kernel probes need to self-filter because they fire for everything and are using globals to filter, I would not be surprised if it turned out that the systemtap probes used futexes and that’s what’s going on.  It’s not trivial to find out because the latencytap probes can’t really get a good native userspace backtrace (the bug) and when I dabbled in that area I managed to hard lock my system and I really dislike rebooting.  So a mystery they will stay.  Unless someone tells me or I read more of the systemtap source or implement hover-brushing in the visualization or otherwise figure things out.

There is probably more to come, including me running the probes against a bunch of mozilla-central/comm-central tests and putting the results up in interactive web-app form (with the distilled JSON available).  It sounds like I might get access to a MoCo VM to facilitate that, which would be nice.

fighting non-deterministic xpcshell unit tests through causality tracking with systemtap; step 1

It’s a story as old as time itself.  You write a unit test.  It works for you.  But the evil spirits in the tinderboxes cause the test to fail.  The trick is knowing that evil spirits are a lot like genies.  When you ask for a wish, genies will try and screw you over by choosing ridiculous values wherever you forgot to constrain things.  For example, I got my dream job, but now I live in Canada.  The tinderbox evil spirits do the same thing, but usually by causing pathological thread scheduling.

This happened to me the other day and a number of our other tests are running slower than they should, so I decided it was time for another round of incremental amortized tool-building.  Building on my previous systemtap applied to mozilla adventures by porting things to the new JS representations in mozilla-2.0 and adding some new trace events I can now generate traces that:

  • Know when the event loop is processing an event.  Because we reconstruct a nested tree from our trace information and we have a number of other probes, we can also attribute the event to higher-level concepts like timer callbacks.
  • Know when a new runnable is scheduled for execution on a thread or a new timer firing is scheduled, etc.  To help understand why this happened we emit a JS backtrace at that point.  (We could also get a native backtrace cheaply, or even a unified backtrace with some legwork.)
  • Know when high-level events occur during the execution of the unit test.  We hook the dump() implementations in the relevant contexts (xpcshell, JS components/modules, sandboxes) and then we can listen in on all the juicy secrets the test framework shouts into the wind.  What is notable about this choice of probe point is that it:
    • is low frequency, at least if you are reasonably sane about your output.
    • provides a useful correlation between what it is going on under the hood with something that makes sense to the developer.
    • does not cause the JS engine to need to avoid tracing or start logging everything that ever happens.

Because we know when the runnables are created (including what runnable they live inside of) and when they run, we are able to build what I call a causality graph because it sounds cool.  Right now this takes the form of a hierarchical graph.  Branches form when a runnable (or the top-level) schedules more than one runnable during the execution of a single runnable.  The dream is to semi-automatically (heuristics / human annotations may be required) transform the hierarchical graph into one that merges these branches back into a single branch when appropriate.  Collapsing linear runs into a single graph node is also desired, but easy.  Such fanciness may not actually be required to fix test non-determinism, of course.

The protovis-based visualization above has the following exciting bullet points describing it:

  • Time flows vertically downwards.  Time in this case is defined by a globally sequential counter incremented for each trace event.  Time used to be the number of nanoseconds since the start of the run, but there seemed to somehow be clock skew between my various processor cores that live in a single chip.
  • Horizontally, threads are spaced out and within those threads the type of events are spaced out.
    • The weird nested alpha grey levels convey nesting of JS_ExecuteScript calls which indicates both xpcshell file loads and JS component/module top-level executions as a result of initial import.  If there is enough vertical space, labels are shown, otherwise they are collapsed.
  • Those sweet horizontal bands convey the various phases of operation and have helpful labels.
  • The nodes are either events caused by top-level runnable being executed by the event loop or important events that merit the creation of synthetic nodes in the causal graph.  For example, we promote the execution of a JS file to its own link so we can more clearly see when a file caused something to happen.  Likewise, we generate new links when analysis of dump() output tells us a test started or stopped.
  • The blue edges are expressing the primary causal chain as determined by the dump() analysis logic.  If you are telling us a test started/ended, it only follows that you are on the primary causal chain.
  • If you were viewing it in a web browser, you could click on the nodes and it would console.log them and then you could see what is actually happening in there.  If you hovered over nodes they would also highlight their ancestors and descendents in various loud shades of red.

  • The specific execution being visualized had a lot of asynchronous mozStorage stuff going on.  (The right busy thread is the asynchronous thread for the database.)  The second image has the main init chain hovered, resulting in all the async fallout from the initialization process being highlighted in red.  At first glance it’s rather concerning that the initialization process is still going on inside the first real test.  Thanks to the strict ordering of event queues, we can see that everything that happens on the primary causal chain after it hops over to the async thread and back is safe because of that ordering.  The question is whether bad things could happen prior to that joining.  The answer?  In another blog post, I fear.
    • Or “probably”, given that the test has a known potential intermittent failure.  (The test is in dangerous waters because it is re-triggering synchronous database code that normally is only invoked during the startup phase before references are available to the code and before any asynchronous dispatches occur.  All the other tests in the directory are able to play by the rules and so all of their logic should be well-ordered, although we might still expect the initialization logic to likewise complete in what is technically a test phase.  Since the goal is just to make tests deterministic (as long as we do not sacrifice realism), the simplest solution may just be to force the init phase to complete before allowing the tests to start.  The gloda support logic already has an unused hook capable of accomplishing this that I may have forgotten to hook up…

Repo is my usual systemtapping repo.  Things you might type if you wanted to use the tools follow:

  • make SOLO_FILE=test_name.js EXTRA_TEST_ARGS=”–debugger /path/to/tb-test-help/systemtap/chewchewwoowoo.py –debugger-args ‘/path/to/tb-test-help/systemtap/mozperfish/mozperfish.stp –‘” check-one
  • python /path/to/tb-test-help/chewchewwoowoo.py –re-run=/tmp/chewtap-##### mozperfish/mozperfish.stp /path/to/mozilla/dist/bin/xpcshell

The two major gotchas to be aware of are that you need to: a) make your xpcshell build with jemalloc since I left some jemalloc specific memory probes in there, and b) you may need to run the first command several times because systemtap has some seriously non-deterministic dwarf logic going on right now where it claims that it doesn’t believe that certain types are actually unions/structs/whatnot.