overview ownership/communication graphs for rich execution logs

relationship-overview-spgm

My last blog post covered the fancy pants logging being used for the deuxdrop project.  To summarize:

  • we have loggers
  • they are organized by ownership hierarchy
  • they provide sufficient metadata that we can reconstruct the loggers that were talking to each other
This can result in a lot of loggers.  If you look at the log output from the last blog post (caution: BIG JSON file in standalone ArbPL instance) you might notice a list of loggers that looks something like the below, except not quite as sideways or shrunk:

last generation's logger hierarchy rotated sideways

Obviously, that much raw data is not super helpful.  So now we process the hierarchy, constructing graph nodes or aggregate graph nodes for things that are interesting in their own or in aggregate.  We use d3 of the vaunted protovis lineage to visualize the network and graphviz to lay it out.

d3 has a super-polished, fun-to-use interactive force-directed graph implementation, but graphviz’s circo layout produces better results.  Given that ArbPL already has a processing step for intake, it wasn’t too much extra work to include a step where we use the same JS code as on the client to generate a dot file, pass it to circo to lay it out, then extract the layout information and store it with the log data.  Many props to Gregoire Lejeune for his node-graphviz bindings that made it so easy to do.

overview-z-joined-notif-highlighted

Although the overview graph on its own is neat, it becomes useful by showing us the involved loggers/actors in a test step by highlighting them.  It does this by listening for wmsy‘s focus change events to know what the focused test step is.  (Since mouse interaction also causes toggling, it’s easiest to appreciate the process by using the up/down arrow keys to change focus without expanding the steps.  And if you want to toggle the expanded state without involving the mouse, you can hit the enter key.)

z-joined-step-callout-causes-highlighting

For reference, the steps look like the above, and the highlighted one has the ever-so-fashionable glowing fancy focus ring.

If you would like to see this for yourself, you can check out the archived (and therefore less likely to break) standalone version of the example log file: https://clicky.visophyte.org/examples/arbpl-loggest/20110720/.  The previously super-huge JSON file is now about an order-of-magnitude smaller because I started eliding large strings that are of no human interest.

new adventures in rich (execution) logs for debugging and program understanding

Understanding what is going on inside software can be very hard, even for the developers most familiar with the software.  During my time working on Thunderbird I used a variety of techniques to try and peer inside: printf/dump/console.log, debuggers, execution analysis (dtrace, chronicle recorder, with object diffs, on timelines), logging (log4j style, with  timelines, with rich data, extra instrumentation and custom presentations, prettier and hooked up to dump on test failures), improving platform error reporting, gdb extensions, control-flow analysis of SQL queries (vanilla, augmented with systemtap perf probes), performance analysis (VProbes with custom UI, systemtap, crammed into the SpeedTracer UI, custom UI with the async work), chewing existing log facilities’ output (TB IMAPgecko layout), and asynchronous operation causality reconstruction (systemtap, JS promises).

Logging with rich, structured data easily provided the most bang-for-the-buck because it:

  1. Provided the benefit of baked-in human meaning with some degree of semantic hierarchy.
  2. Was less likely to make wrong assumptions about what data was relevant.  How many times have you had to go back to change what a printf is logging?
  3. Once sufficiently automated, required no activation energy, no extra steps, and everyone can see the results.
However, it still has numerous downsides/gotchas:
  1. Potential performance impact, especially with rich, structured data.
  2. If people don’t write log statements, you don’t get log entries.
  3. If an error propagates and no one catches it or otherwise says anything about it, your log trace stops dead.
  4. Lack of context can hide causation and leave you filtering through tons of entries trying to reconstruct what happened from shadows on the cave wall.


As a result, when I recently started on a new project (implemented in JS), I tried to make sure to bake logging into the system from the ground up:
  • The core classes, abstractions, and APIs generate log entries automatically so developers don’t need to fill their code with boilerplate.
  • Loggers are built around object ownership hierarchies/life-cycles to provide context and the ability to filter.  This is in contrast to log4j style logging which is usually organized around code module hierarchies, noting that log4j does provide nested diagnostic contexts.
  • The test framework is designed around writing tests in terms of expectations around the loggers.  This helps ensure interesting things get logged.  It also improves the quality of the tests by making it easier to ensure the tests are really doing what you think they are doing.
  • Logger definitions explicitly name the log events they will generate and their semantic type, some of which have special handling.  The currently supported types are: state changes, latched states, events, asynchronous jobs (with separate begin and end entries), calls (which wrap a function call, catching exceptions), and errors.  This allows specialized processing and better automated analysis without having to try and reverse engineer the meaning using regular expressions.
  • Performance is addressed by instantiating different logger classes based on needs.  For modules not under test (or without logging desired), everything turns into no-ops except for events and errors which are counted for reporting to a time-series database for system health/performance/etc analysis.  The decision making process happens at runtime and is able to see the parent logger, so heavy-weight logging can be used on a statistical sampling basis or only for specific users experiencing problems/etc.
  • Loggers can give themselves complex semantic names that can be used to reconstruct relationships between loggers when the ownership hierarchy is not available or not appropriate.  For example, we can link both sides of the connection between a client and a server by having the loggers make sure to name themselves and the other side.
  • Simple wrapper helpers exist that make it easy to wrap a function so that a custom log entry is generated and it “holds” the call in limbo from whence it can later be “released”.  This allows unit tests to break complicated behaviour into discrete steps that humans can understand.  Far better to look at one thing at a time than eight things all jumbled together (or filtered back down to one, potentially hiding important details).


In any event, as one might surmise from the screenshots, this is more than a dream, it’s a pastel colored reality.

What are the screenshots showing?

  1. The logger hierarchy.  The colored bits are “named things”.  The test framework has the concept of things, actors, and loggers.  Each actor corresponds to exactly one logger and is the object on which tests specify their expectations.  Actors can be owned by other actors, resulting in a hierarchy we call a family.  Each family gets tagged with a distinct identifier that allows us to associate a color with them.  Things provide a human name to a (hopefully) unique string.  Things can be owned by actors and get tagged with the family name and so can be colorized.  In the logger hierarchy, the stuff to the right of the colon is the semantic name of the logger.  So “clientConn: A client to X longtermat endpoint blah” is really (under the hood) an array of strings where “A client” is actually the crypto key so named.  There are two colors because the connection is naming both its own identifying crypto key and the server’s crypto key it is trying to talk to.
  2. An example of the display of log entries.  Each logger gets its own column to display its entries in.  The header shows the name of the logger and is colored based on that logger’s family.  The colors were not shown in the logger hierarchy because I think it would end up too busy.  Each entry is timestamped with the number of milliseconds since the start of the test.  The event names are arbitrarily in blue to help delineate them from other semantic classes.  For example, “handleMsg” is a call-type.  The “obj” bits with the dotted stuff under it means something we can click on to see more of.  The events being shown are part of a CurveCP-style connection establishment.
  3. Similar to the previous screenshot, but here you can see named thing resolution in play with arguments that are strings.
  4. And if we click on one of those “obj” bits, we get a nice nested table display of the object.  As you can see from the pretty colors, named thing resolution is also in play.  You can also see crypto keys I did not name and which accordingly look like gibberish.  It is probably worth noting that some developer participation is required to make sure to put toJSON() implementations on all the complex objects that are exposed to the logger to make sure we don’t try and serialize huge swathes of object graph.  While this is a “don’t break the system” requirement, it also makes it easy to expose the useful bits of information for debugging.

If you would like to see the actual log display UI for yourself on the log from the screenshots (and can stomach it fetching 2+ MiB of compressed JSON), you can see it at https://clicky.visophyte.org/examples/arbpl-loggest/20110712/.  While the logs normally live on the ArbitraryPushlog (ArbPL) server, links to it are currently not stable because its all-in-one hbase datastore keeps self-destructing.  I baked ArbPL into a standalone form that lives at that URL and so should ideally not break so much.  Fingers-crossed.

unified JS/C++ backtraces, colorized backtraces, colorized source listing for gdb 7.3/archer-trunk updated

type "mbt", see this.

gdb has had integrated python support for some time and it is truly awesome.  The innards have changed here and there, so my previous efforts to show colorized/fancy backtraces, show colorized source listings, and provide unified JS/C++ mozilla backtraces (with colors still) have experienced some bit-rot over time.

type "cbt", see this

I have de-bitrotted the changes, hard.  Hard in this case means that the changes depend on gdb 7.3 which only exists in the future or in the archer repo you can find on this wiki page, or maybe in gdb upstream but I already had the archer repo checked out…

type "sl", see this.

In any event, if you like gdb and work with mozilla, you will not only want these things, but also Jim Blandy’s mozilla-archer repo which has magic SpiderMonkey JS helpers (one of which mozbt depends on; those JSStrings are crazy, yo!).  Coincidentally, he also depends on the future, and his README tells you how to check out the archer branch in greater detail.

You can get your own copy of these very exciting gdb python things from my github pythongdb-gaudy repo.

The important notes for the unified backtrace are:

  • It does’t work with the tracing JIT; the trace JIT doesn’t produce the required frames during its normal operation.
  • It might work with the method JIT if gdb could unwind method JIT frames, but it doesn’t seem to do that yet.  (Or I didn’t build with the right flag to tell it to use a frame pointer/etc., or I am using the wrong gdb branch/etc.)  Once the Method JIT starts telling gdb about its generated code with debug symbols and the performance issues in gdb’s JIT interface are dealt with, you can just use the colorizing backtrace because no special logic is required to interleave frames at that point and Jim Blandy’s magic JS pretty printers should ‘just work’.
  • Don’t forget that if you just want a pure JS backtrace (and with all kinds of fanciness) and have a debug build, you can just do “call DumpJSStack()” in gdb and it will call back into XPConnect and invoke the C++ code that authoritatively knows how to walk this stuff.
  • If you’re cool and using generators, then you’re stuck with the interpreter, so it will totally work.

arbitrarypushlog now more realtimey; likes wide screens, humans

Arbitrary Pushlog (ArbPL) recap:

  • It shows revision control pushes and the tinderbox build results for specific build trees like tinderboxpushlog (TBPL).
  • It is backed by a server which has a database so your browser is not going to launch a DOS attack on the mozilla infrastructure.  On the other hand, if that server falls over…
  • It figures out what failed by parsing the failed test logs.  It passes the time savings of this onto you in the form of listing the failures.  It also secretly knows things about failures that it does not tell you.
  • For Thunderbird mozmill test runs that experience failures it scrapes the fancy logging goodness out of the logs and exposes them in a pretty UI.  See the teaser post for screenshots.  You can also check to see if we’ve fixed all the Thunderbird mozmill oranges or not and maybe see a fresh new log!
  • It’s not capable of serving as a (full) replacement for TBPL at this time.  It does not show tree status (although that is easily fixed and should be fixed sometime soon), and it currently cannot star builds.

What’s new:

  • Widescreen display friendly.  It previously assumed you were me and ran your screen in portrait mode because that is the way you can see the most code; now it spills to two columns if your window is at least 1400px wide.  (See top screenshot.)
  • TraceMonkey’s mobile build matrix is split out from its desktop build matrix because the column sets did not meaningfully overlap.  No attempt has been made to deal with the other unique aspects of the TraceMonkey tree, although at least all known TraceMonkey builds should be categorized.  (If the builds that were triggered off another repo were split out into their own tinderbox tree so they could use the same mechanism Thunderbird and other comm-central complex repos use, no special work would be required.  It sounds like the tupled repo is going away soon, so it likely should become a moot issue.)

  • It now does fancy hierarchical grouping of the failures.  The builder names’ backgrounds are in gray because the failures have been starred.  The builder names would be in orange if the failing builds had not been starred.

  • When people merge things or otherwise push more than 8 changesets, we don’t show you everything they pushed, just the top 3 and provide a link to the full log elsewhere.

  • I made an effort to help explain what is going on with builds in non-secret code.  You click on a build, you get this lovely box.  Unfortunately I apparently also forgot to expose the secret code in the popup like I was planning.

And last, but not least…!

  • ArbPL now uses socket.io magic to provide realtime-ish updates.  Your browser creates a websocket/weird flash object bridge/XHR long-poll/etc. in order to be able to get the build information that’s hot off the press.  The “ish” part of realtime-ish comes from the bit where the presses are a cron job that runs every 3 minutes.  I think I have appropriate abort/retry logic in place now to contend with the half-written JSON and hanging HTTP requests, but I’m still sticking with the safety of a cron job with a built-in death clock until the logs agree with me.

Important caveats:

  • If the server restarts, the client is smart enough to reconnect, but not smart enough to re-establish its subscriptions with the server.  Refreshing the page or clicking the ArbPL logo in the upper left to go back to the list of trees and then picking a tree will resolve this issue.  The server only restarts when I push to production, as it were, so there is some other problem if you find yourself constantly needing to refresh.
  • Builders in the failure list look like they want to do something when you click on them, but this is a lie for all non-Thunderbird mozmill builders at the current time; those are the secrets ArbPL is keeping from you.

You can use ArbPL for yourself at arbpl.visophyte.org.  You can make your own using the source on github.

As noted by mcote in his post on autolog, the automation team is working on something in this domain, autolog, and I’m hoping to work with them to collaborate / pass-the-torch / or port Thunderbird’s mozmill logging to their solution so Thunderbird can have its fancy logging cake but not have to bake it too.

If you would like to discuss ArbPL/autolog/etc., I think the mozilla.tools group is supposed to be the right place for that.  One caveat is that I can’t seem to find the mailing list proper to sign up, just the newsgroup and google group…?  (Neither https://lists.mozilla.org/listinfo or https://mail.mozilla.org/listinfo/ seem to know about it.)

build matrices for arbitrarypushlog

A TraceMonkey Push

As I mentioned in my teaser on rich thunderbird mozmill logs, in order to get the build logs and provide failure clustering you already have to do most of the stuff tinderboxpushlog does.  One of the key things is summarizing the builds in a way that is useful, where the definition of “useful” probably varies a lot between users.

While Thunderbird has an extremely boring set of build types (build, xpcshell, mozmill), my first take on summarizing them was no good.  While fixing it, I decided to feature creep (out of my hobby time allocation) and see if I could create a presentation that could handle the prolific Firefox and TraceMonkey trees.

A Firefox Push

While I am not going to claim it’s perfect, I like it.  It’s probably also important to caveat that not all Tracemonkey builds are categorized.  The mobile talos runs identify themselves by a completely different set of names from the desktop ones, and there’s not really room for columns for that.  Additionally, some builds cite a revision for “mobile-browser”, but we ignore that extra meta-data.  Although the design was intended to handle Thunderbird’s repository where each build is a tuple of “comm-central” and “mozilla-central” revision used, we really need to have that tuple for every build in the tinderbox tree, and TraceMonkey is not providing it.  (We could kick builds without the info to the “outer” push as an enhancement.)

A Thunderbird (well, comm-central) push.

As a gesture of friendship to non-Thunderbird trees, we now also process mochitest and reftest logs, although I’m failing to surface some of the details retrieved in the UI.

Anywho, you can see arbpl in action for yourself at arbpl.visophyte.org.  It cron scrapes every 5 minutes.  The error recovery logic is not production-grade yet; the scraper can fall victim to partially written tinderbox JSON files on the tinderbox server, which means that some trees might not see updates for longer than that.  And various other things may go wrong too.  The client does not auto-refresh or use Socket.IO or anything.  If you want to run your own, hit github.  If you want to read the source, you should probably hit github too, because the production serving mode is reasonably optimized and crams all the JS into a single (gzipped) file.

teaser: Rich contextual information for Thunderbird mozmill failures

Sometimes Thunderbird mozmill unit tests fail.  When they do, it’s frequently a mystery.  My logsploder work helped reduce the mystery for my local mozmill test runs, but did nothing for tinderbox runs or developers without tool fever.  Thanks to recent renewed activity on the Thunderbird front-end, this has become more of a problem and so it was time for another round of amortized tool building towards a platonic ideal.

The exciting pipeline that leads to screenshots like you see in this post:

  • Thunderbird Mozmill tests run with the testing framework set to log semi-rich object representations to in-memory per-test buckets.
  • In the event of a test failure, the in-Thunderbird test framework:
    • Gathers information about the state of the system now that we know there is a failure and emit it.  This takes the form of canvas-based screenshots (using chrome privileges) of all open windows in the application, plus the currently focused element in the window.
    • Emits (up to) the last 10 seconds of log events from the previous test.
    • Emits all of the log events from the current test.
  • The python test driver receives the emitted data and dumps it to stdout in a series of JSON blobs that are surrounded by magical annotations.
  • A node.js daemon doing the database-based tinderboxpushlog thing (like my previous Jetpack/CouchDB work that found CouchDB to not be a great thing to directly expose to users and died, but now with node and hbase) processes the tinderbox logs for the delicious JSON blobs.
    • It also processes xpcshell runs and creates an MD5 hash that attempts to characterize the specific fingerprint of the run.  Namely, xpcshell emits lines prefixed with “TEST-” that have a regular form to describe when the pending test count changes or when specific comparison operations or failures occur.  It is assumed that tests will not comparison check values that are effectively random values, that the comparisons will tend to be deterministic (even if there are random orderings in the test) or notable when not deterministic, and thus that the trace derived from this filtering and hashing will be sufficiently consistent that similar failures should result in identical hashes.
    • Nothing is done with mochitests because: Thunderbird does not have them, they don’t appear to emit any context about their failures, and as far as I can tell, frequently the source of a mochitest failure is the fault of an earlier test that claimed it had completed but still had some kind of ripples happening that broke a later test.
  • A wmsy-based UI does the UI thing.

    The particular failure shown here is an interesting one where the exception is telling us that a popup we expected to open never opened.  But when we look at the events from the log, we can see that what happened is the popup opened and then immediately closed itself.  Given that this happened (locally) on linux, this made me suspect that the window manager didn’t let the popup acquire focus and perform a capture.  It turns out that I forgot to install the xfwm4 window manager on my new machine which my xvnc session’s xstartup script was trying to run in order to get a window manager that plays nicely with mozmill and our focus needs.  (Many window managers have configurable focus protection that converts a window trying to grab focus into an attention-requested notification.)

    This is a teaser because it will probably be a few more days before the required patch lands on comm-central, I use RequireJS‘ fancy new optimizer to make the client load process more efficient, and I am happy that the server daemons can keep going for long stretches of time without messing up.  The server and client code is available on github, and the comm-central patch from hg.

    why so slow, pushlog?

    I am doing something where I need to talk to the Mozilla hg pushlog.  I noticed things were running disturbingly slow, so I figured I’d look into it.  I’m using node.js so htracr (a node.js, libpcap-based via node_pcap http transaction visualizer) seemed like the easiest and most fun way to figure out what is going on.  (In a web browser I would just use the built-in timeline.)
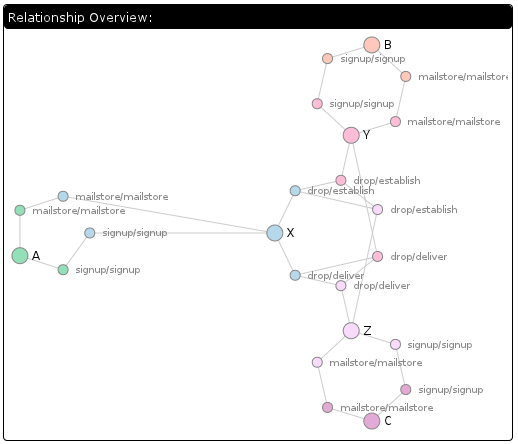
    slooooooooooow...

    The short request is a comm-central pushlog request by date.  The long request is a mozilla-central pushlog request by date.  mozilla-central has more pushes, suggesting that the query is either doing something sketchy like a table scan or there is lock contention.  Quick investigation showed no successful pushes in the given timeframe, eliminating lock contention from the likely list of causes.  (The implementation uses SQLite, which, when not running with the Write-Ahead-Log enabled, will only experience contention when the reads are occurring from separate connections.)

    This suggests the query is doing a table scan.  This tends to be a reasonably straightforward problem.  But since I have a SQLite opcode visualizer in my toolkit (now on github!) that needs plugs periodically to keep it on the tip of everyone’s tongue, I used that. Plug! Plug! Plug!

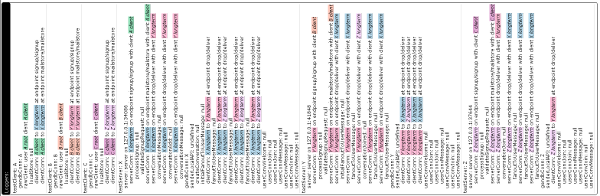
    If you care about these kind of things, click on the small image on the left and look for the red text.  The giant warning flag is the “Rewind” on the changesets table and the control flow that performs a “Next”  that appears to be part of a loop case right off the bat.  (Note that this is using SQLite 3.6.23.1 since I assume that’s what hg.mozilla.org is using.)  Summary: we perform one table scan of the changesets table for every push in the date range.

    The “bad” schema is:

    CREATE TABLE changesets (pushid INTEGER, rev INTEGER, node text);
    CREATE TABLE pushlog (id INTEGER PRIMARY KEY AUTOINCREMENT, user TEXT, date INTEGER);
    CREATE UNIQUE INDEX changeset_node ON changesets (node);
    CREATE UNIQUE INDEX changeset_rev ON changesets (rev);
    CREATE INDEX pushlog_date ON pushlog (date);
    CREATE INDEX pushlog_user ON pushlog (user)

    The query is: SELECT id, user, date, node from pushlog LEFT JOIN changesets ON id = pushid WHERE date > 1298306930 AND date < 1298306955 ORDER BY id DESC, rev DESC;

    The query plan via EXPLAIN QUERY PLAN from SQLite 3.6.23.1 on the “bad” schema is:

    0|0|TABLE pushlog WITH INDEX pushlog_date
    1|1|TABLE changesets

    This is obvious if you know what you’re looking for; unfortunately the indication of the problem is the lack of “WITH INDEX” or the like rather than text that calls out the problem. The much nicer SQLite 3.7.4 EXPLAIN QUERY PLAN (which has great documentation!) would make the problem much more obvious by saying “SCAN TABLE” if not for the fact that it ends up creating an automatic index:

    0|0|0|SEARCH TABLE pushlog USING INDEX pushlog_date (date>? AND date<?) (~110000 rows)
    0|1|1|SEARCH TABLE changesets USING AUTOMATIC COVERING INDEX (pushid=?) (~7 rows)
    0|0|0|USE TEMP B-TREE FOR ORDER BY

    Although one table scan accompanied by a b-tree building is probably a better idea than N table scans, if you read this and think “SQLite 3.7.x just saved someone’s bacon”, you would be wrong because it still throws away the index at the end.  The server is still experiencing an initial vicious kick in the pants every time the statement is run; there are just no lighter follow-up kicks (lighter because of the OS disk cache, you see…).

    In any event, the problem is that there is no index on the pushid column in the changesets table.  (And pushid can’t be the primary key because it is not unique.  There’s no benefit to using a composite key since SQLite will still create a simple rowid key once we use a composite, so an index is the way to go.)

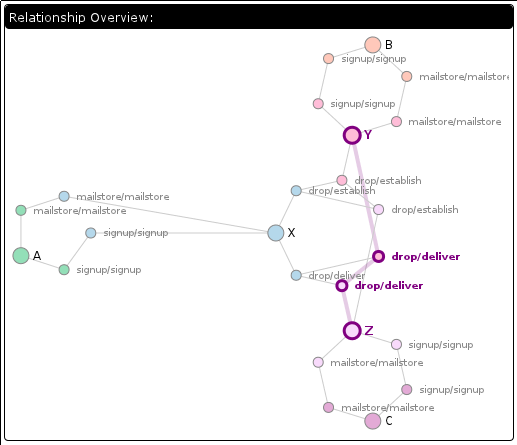
    Once we fix this, our graph looks like the second one at left (in SQLite 3.6.23.1).  Again, looking for red text and now also orange text, the key things are that we no longer have a “Rewind” or “Next”, and instead have a SeekGe on the index and a Seek on the table using the row id the index told us about.  (We are not using a covering index because we expect extremely high locality in the table based on rowid because the insertions happen consecutively in a single transaction.)

    The 3.6.23.1 query plan now looks like:

    0|0|TABLE pushlog WITH INDEX pushlog_date
    1|1|TABLE changesets WITH INDEX changeset_pushid

    Much nicer! What does the lovely 3.7.4 say?:

    0|0|0|SEARCH TABLE pushlog USING INDEX pushlog_date (date>? AND date<?) (~110000 rows)
    0|1|1|SEARCH TABLE changesets USING INDEX changeset_pushid (pushid=?) (~10 rows)
    0|0|0|USE TEMP B-TREE FOR ORDER BY

    Awww yeah. Anywho, here’s the schema one wants to use:

    CREATE TABLE changesets (pushid INTEGER, rev INTEGER, node text);
    CREATE TABLE pushlog (id INTEGER PRIMARY KEY AUTOINCREMENT, user TEXT, date INTEGER);
    CREATE INDEX changeset_pushid ON changesets (pushid);
    CREATE UNIQUE INDEX changeset_node ON changesets (node);
    CREATE UNIQUE INDEX changeset_rev ON changesets (rev);
    CREATE INDEX pushlog_date ON pushlog (date);
    CREATE INDEX pushlog_user ON pushlog (user);

    I am off to file this as a bug… filed as bug 635765.

    UPDATE: I initially had a brain glitch where I proposed using a primary key rather than an additional index.  Unfortunately, this is what got pushed out to feed readers during the 30 seconds before I realized my massive mistake.  If you have come to this page to note the bad-idea-ness of that, please enjoy the corrected blog-post which explains why the primary key is not the best idea before going on to point out any other serious brain glitches 🙂

    UPDATE 2 (Feb 22, 2011):  Good news: the change has landed and all the existing databases have been updated.  Woo!  Bad news: although things are probably faster now, things are still way too slow.  (Given that this specific deficiency was determined by inspection and not actual profiling, this is not so surprising.)  It would appear that the retrieval of the information about the changesets is the cause of the slowdown.  More inspection on my part suggests that populating the list of tags may be involved, but that’s just a quick guess.  Please follow the bug or follow-on bugs if you want to witness the entire exciting saga.

    logsploder, circa a year+ ago

    Whoops.  I posted to mozilla.dev.apps.thunderbird about an updated version of logsploder at the end of 2009, but forgot to blog about it.  I do so now (briefly) for my own retrospective interest and those who like cropped screenshots.

    The gloda (global database) tests and various Thunderbird mozmill tests have been augmented for some time (1+ years) to support rich logging where handlers are given the chance to extract the salient attributes of objects and convert them to JSON for marshaling.  Additionally, when the fancy logging mode is enabled, additional loggers are registered (like Thunderbird’s nsIMsgFolderListener) to provide additional context for what is going on around testing operations.

    For a given test (file) run, logsploder provides an overview in the form of a hierarchical treemap that identifies the logger categories used in the test and a small multiples timeline display that characterizes the volume of messages logged to each category in a given time slice using the treemap’s layout.  The idea is that you can see at a glance the subsystems active for each time-slice.

    Logsploder can retain multiple test file runs in memory:

    And knows the tests and sub-tests run in each test file (xpcshell) run.  Tests/sub-tests are not green/red coded because xpcshell tests give up as soon as the first failure is encountered so there is no real point:

    Clicking on a test/subtest automatically selects the first time slice during which it was active.

    Selecting a time-slice presents us with a simple list of the events that occurred during that time slice.  Each event is colored (although I think darkened?) based on its logging category:

    Underlined things are rich object representations that can be clicked on to show additional details.  For example, if we click on the very first underlined thing, “MsgHdr: imap://user@localhost/gabba13#1” entry, we get:

    And if we click on the interestingProperties OBJECT:

    Logsploder was a pre-wmsy (the widget framework that I’ll be talking about more starting a few weeks from now) tool whose UI implementation informed wmsy.  Which is to say, the need to switch to a different tab or click on the “OBJECT” rather than supporting some more clever form of popups and/or inline nesting was a presentation limitation that would not happen today.  (More significantly, the log events would not be paged based on time slice with wmsy, although that limitation is not as obvious from the way I’ve presented the screenshots.)

    If anyone in the Thunderbird world is interested in giving logsploder a spin for themselves, the hg repo is here.  I also have various patches that I can cleanup/make available in my patch queue to support logging xpcshell output to disk (rather than just the network), hooking up the logHelper mechanism so it reports data to mozmill over jsbridge, and (likely heavily bit-rotted) mozmill patches to report those JSON blobs to a CouchDB server (along with screenshots taken when failures occur).  The latter stuff never hit the repo because of the previously mentioned lack of a couchdb instance to actually push the results to.  Much of the logHelper/CouchDB work will likely find new life as we move forward with a wmsy-fied Thunderbird Air experiment.

    Many thanks to sid0 who has continued to improve logHelper, if sometimes only to stop it from throwing exceptions on newly logged things that its heuristics fatally did not understand 🙂

    teaser: code completion in skywriter/ajax.org code editor using jstut and narcissus

    I’ve hooked up jstut’s (formerly narscribblus‘) narcissus-based parser and jsctags-based abstract interpreter up to the ajax.org code editor (ace, to be the basis for skywriter, the renamed and somewhat rewritten bespin).  Ace’s built-in syntax highlighters are based on the somewhat traditional regex-based state machine pattern and have no deep understanding of JS.  The tokenizers have a very limited stateful-ness; they are line-centric and the only state is the state of the parser at the conclusion of tokenizing the previous line.  The advantage is that they will tend to be somewhat resilient in the face of syntax errors.

    In contrast, narcissus is a recursive descent parser that explodes when it encounters a parse error (and takes all the state on the stack at the point of failure with it).  Accordingly, my jstut/narscribblus parser is exposed to ace through a hybrid tokenizer that uses the proper narcissus parser as its primary source of tokens and falls back to the regex state machine tokenizer for lines that the parser cannot provide tokens for.  I have thus far made some attempt at handling invalidation regions in a respectable fashion but it appears ace is pretty cavalier in terms of invalidating from the edit point to infinity, so it doesn’t really help all that much.

    Whenever a successful parse occurs, the abstract interpreter is kicked off which goes and attempts to evaluate the document.  This includes special support for CommonJS require() and CommonJS AMD define() operations.  The require(“wmsy/wmsy”) in the screenshot above actually retrieves the wmsy/wmsy module (using the RequireJS configuration), parses it using narcissus, parses the documentation blocks using jstut, performs abstract interpretation and follow-on munging, and then returns the contents of that namespace (asynchronously using promises) to the abstract interpreter for the body of the text editor.  The hybrid tokenizer does keep around a copy of the last good parse to deal with code completion in the very likely case where the intermediate stages of writing new code result in parse failures.  Analysis of the delta from the last good parse is used in conjunction with the last good parse to (attempt to) provide useful code completion

    The net result is that we have semantic information about many of the tokens on the screen and could do fancy syntax highlighting like Eclipse can do.  For example, global variables could be highlighted specially, types defines from third party libraries could get their own color, etc.  For the purposes of code completion, we are able to determine the context surrounding the cursor and the appropriate data types to use as the basis for completion.  For example, in the first screenshot, we are able to determine that we are completing a child of “wy” which we know to be an instance of type WmsyDomain from the wmsy namespace.  We know the children of the prototype of WmsyDomain and are able to subsequently filter on the letter “d” which we know has been (effectively) typed based on the position of the cursor.  (Note: completion items are currently not sorted bur rather shown in definition order.)

    In the second example, we are able to determine that the cursor is in an object initializer, that the object initializer is the first argument of a call to defineWidget on “wy” (which we know about as previously described).  We accordingly know the type constraint on the object initializer and thus know the legal/documented key names that can be used.

    This is not working enough to point people at a live demo, but it is exciting enough to post teaser screenshots.  Of course, the code is always available for the intrepid: jstut/narscribblus, wmsy.  In a nutshell, you can hit “Alt-/” and the auto-completion code will try and do its thing.  It will display its results in a wmsy popup that is not unified with ace in terms of how focus is handled (wmsy’s bad).  Nothing you do will actually insert text, but if you click outside of the popup or hit escape it will at least go away.  The egregious deficiencies are likely to go away soon, but I am very aware and everyone else should be aware that getting this to a production-quality state you can use on multi-thousand line files with complex control flow would likely be quite difficult (although if people document their types/signatures, maybe not so bad).  And I’m not planning to pursue that (for the time being); the goal is still interactive, editable, tutorial-style examples.  And for these, the complexity is way down low.

    My thanks to the ajax.org and skywriter teams; even at this early state of external and source documentation it was pretty easy to figure out how various parts worked so as to integrate my hybrid tokenizer and hook keyboard commands up.  (Caveat: I am doing some hacky things… :))  I am looking forward to the continued evolution and improvement of an already great text editor component!

    Visualizing asynchronous JavaScript promises (Q-style Promises/B)

    Asynchronous JS can be unwieldy and confusing.  Specifically, callbacks can be unwieldy, especially when you introduce error handling and start chaining asynchronous operations.  So, people frequently turn to something like Python’s Twisted‘s deferreds which provide for explicit error handling and the ability for ‘callbacks’ to return yet another asynchronous operation.

    In CommonJS-land, there are proposals for deferred-ish promises.  In a dangerously concise nutshell, these are:

    • Promises/A: promises have a then(callback, errback) method.
    • Promises/B: the promises module has a when(value, callback, errback) helper function.

    I am in the Promises/B camp because the when construct lets you not care whether value is actually a promise or not both now and in the future.  The bad news about Promises/B is that:

    • It is currently not duck typable (but there is a mailing list proposal to support unification that I am all for) and so really only works if you have exactly one promises module in your application.
    • The implementation will make your brain implode-then-explode because it is architected for safety and to support transparent remoting.

    To elaborate on the (elegant) complexity, it uses a message-passing idiom where you send your “when” request to the promise which is then responsible for actually executing your callback or error back.  So if value is actually a value, it just invokes your callback on the value.  If value was a promise, it queues your callback until the promise is resolved.  If value was a rejection, it invokes your rejection handler.  When a callback returns a new promise, any “when”s that were targeted at the associated promise end up retargeted to the newly returned promise.  The bad debugging news is that almost every message-transmission step is forward()ed into a subsequent turn of the event loop which results in debuggers losing a lot of context.  (Although anything that maintains linkages between the code that created a timer and the fired timer event or other causal chaining at least has a fighting chance.)

    In short, promises make things more manageable, but they don’t really make things less confusing, at least not without a little help.  Some time ago I created a modified version of Kris Kowal‘s Q library implementation that:

    • Allows you to describe what a promise actually represents using human words.
    • Tracks relationships between promises (or allows you to describe them) so that you can know all of the promises that a given promise depends/depended on.
    • Completely abandons the security/safety stuff that kept promises isolated.

    The end goal was to support debugging/understanding of code that uses promises by converting that data into something usable like a visualization.  I’ve done this now, applying it to jstut’s (soon-to-be-formerly narscribblus’) load process to help understand what work is actually being done.  If you are somehow using jstut trunk, you can invoke document.jstutVisualizeDocLoad(/* show boring? */ false) from your JS console and see such a graph in all its majesty for your currently loaded document.

    The first screenshot (show boring = true) is of a case where a parse failure of the root document occurred and we display a friendly parse error screen.  The second screenshot (show boring = false) is the top bit of the successful presentation of the same document where I have not arbitrarily deleted a syntactically important line.

    A basic description of the visualization:

    • It’s a hierarchical protovis indented tree.  The children of a node are the promises it depended on.  A promise that depended in parallel(-ish) on multiple promises will have multiple children.  The special case is that if we had a “when” W depending on promise X, and X was resolved with promise Y, then W gets retargeted to Y.  This is represented in the visualization as W having children X and Y, but with Y having a triangle icon instead of a circle in order to differentiate from W having depended on X and Y in parallel from the get-go.
    • The poor man’s timeline on the right-hand side shows the time-span between when the promise was created and when it was resolved.  It is not showing how long the callback function took to run, although it will fall strictly within the shown time-span.  Time-bar widths are lower bounded at 1 pixel, so the duration of something 1-pixel wide is not representative of anything other than position.
    • Nodes are green if they were resolved, yellow if they were never resolved, red if they were rejected.  Nodes are gray if the node and its dependencies were already shown elsewhere in the graph; dependencies are not shown in such a case.  This reduces redundancy in the visualization while still expressing actual dependencies.
    • Timelines are green if the promise was resolved, maroon if it was never resolved or rejected.  If the timeline is never resolved, it goes all the way to the right edge.
    • Boring nodes are elided when so configured; their interesting children spliced in in their place.  A node is boring if its “what” description starts with “auto:” or “boring:”.  The when() logic automatically annotates an “auto:functionName” if the callback function has a name.

    You can find pwomise.js and pwomise-vis.js in the narscribblus/jstut repo.  It’s called pwomise not to be adorable but rather to make it clear that it’s not promise.js.  I have added various comments to pwomise.js that may aid in understanding.  Sometime soon I will update my demo setup on clicky.visophyte.org so that all can partake.