
Searchfox (source, config source) is Mozilla’s primary code searching tool for Firefox introduced by Bill McCloskey in 2016 which built upon prior work on DXR. This roadmap post is the second of two posts attempting to lay out where my personal efforts to enhance searchfox are headed and the decision making framework that guides them. The first post was a more abstract product vision document and can be found here.
Discoverable, Extensible, Powerful Queries
Searchfox has a new “query” endpoint introduced in bug 1762817 which is intended to enable more powerful queries. Queries are parsed using :kats‘ query-parser crate which allows us to support our existing (secret) key:value syntax in a more rigorous way (and with automatic parse correction for the inevitable typos). In order to have a sane execution model, these key/value pairs are mapped through an extensible configuration file into a pipeline / graph execution model whose clap-based commands form the basis of our testing mechanism and can also be manually built and run from the command-line via searchfox-tool.
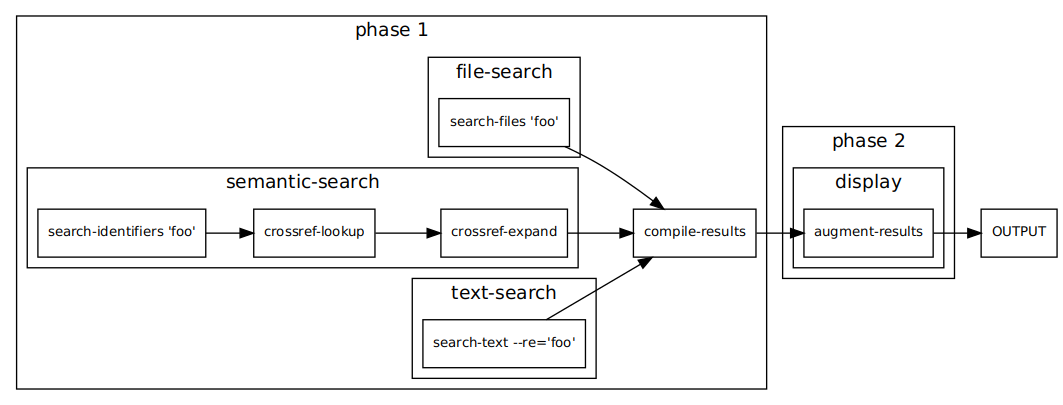
Above you will find a diagram rendering the execution pipeline of searching for foo manually created from the JSON insta crate check output for the query. Bug 1763005 will add automatically generated diagrams as well as further expanding on the existing capability to produce markdown explanations of what is happening in each stage of the pipeline and the values at each stage.
While a new query syntax isn’t exciting on its own, what is exciting is that this infrastructure makes it easier to add functionality with confidence (and tests!). Some particular details worth discussing:
Customizable, Shareable Queries
Bug 1799796: Do you really wish that you could issue a query like webidl:CacheStorage to search just our WebIDL files for “CacheStorage”? Does your team have terminology that’s specific to your team and it would be great to have special search terms/aliases but it would feel wrong to use up all the cool short prefixes for your team? The new query mechanism has plans for these situations!
The new searchfox query endpoint looks like /mozilla-central/query/default. You’ll note that default looks like something that implies there are non-default options. And indeed, the plan is to allow files like this example “preset” dom.toml file to layer additional “terms” and “aliases” onto the base query_core.toml file as well as any other presets you want to build off of. You will need to add your preset to the mozsearch-mozilla repository for the tree in question, but the upside is that any query links you share will work for other people as well!
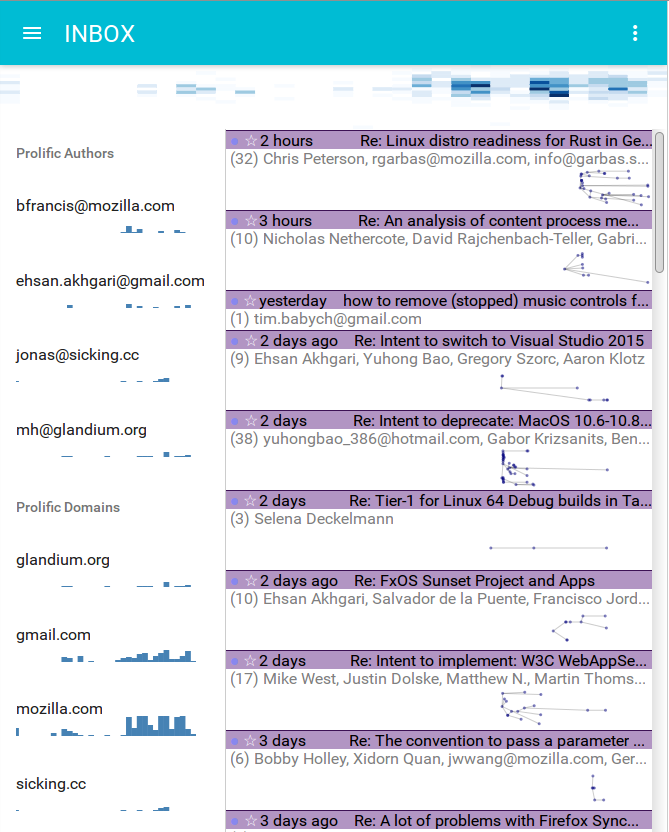
Faceting in Search Results with Shareable URLs
Bug 1799802: The basic idea of faceted search/filtering is:
- You start with a basic search query.
- Your results come back, potentially quite a lot of them. Too many, even!
- The faceting logic looks at the various attributes of the results and classifies or “facets” them. Does that sound too circular? We just throw things in bins. If a bin ends up having a lot of things in it and there’s some hierarchy to its contents, we recursively bin those contents.
- The UI presents these facets (bins), giving you a high level overview of the shape of your results, and letting you limit your results to only include certain attribute values, or to exclude based on others.
- The UI is able to react quickly because it already knows about the result set
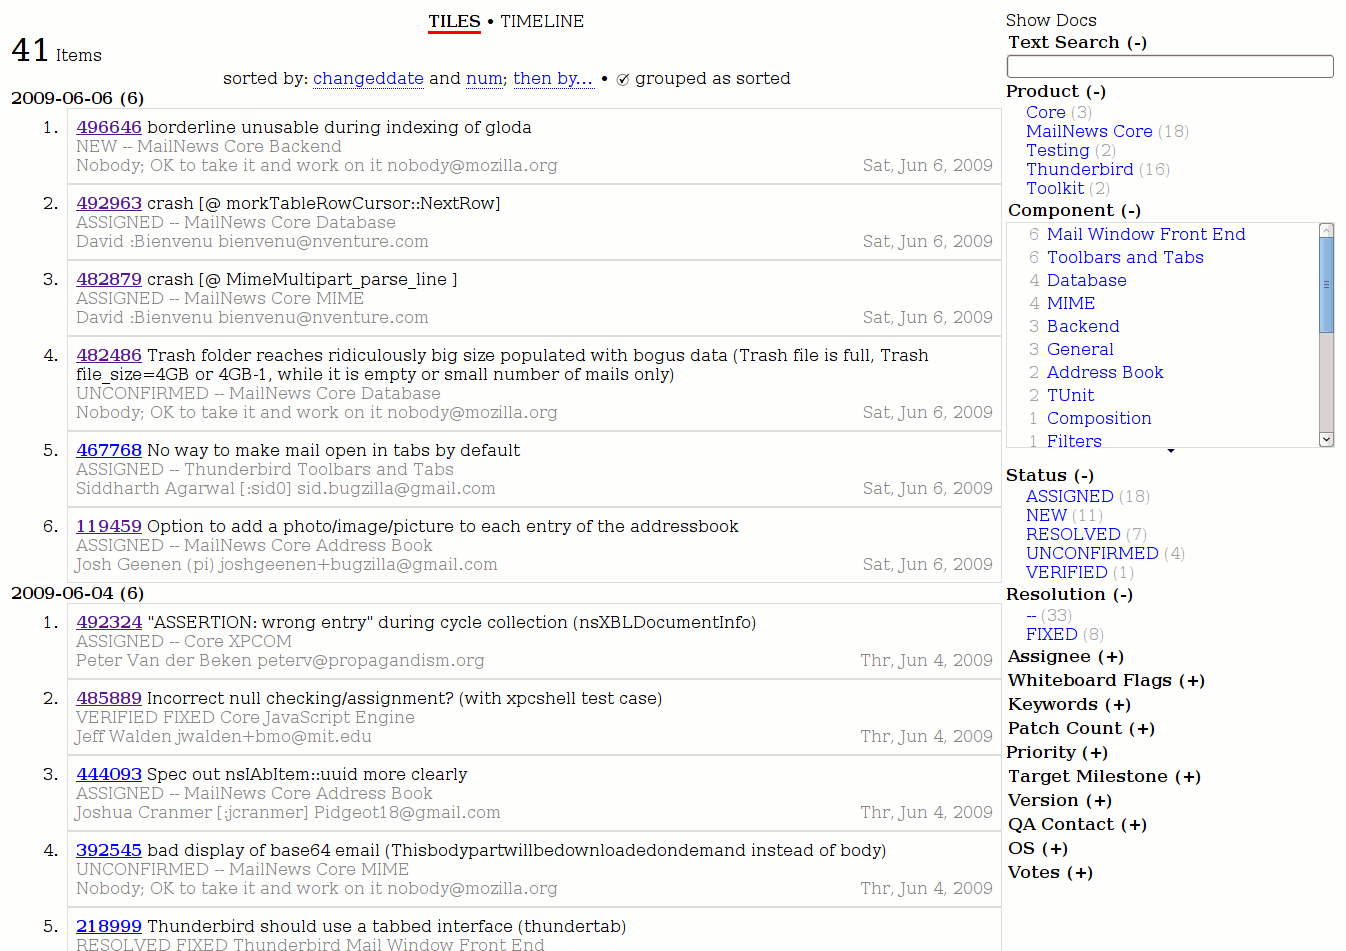
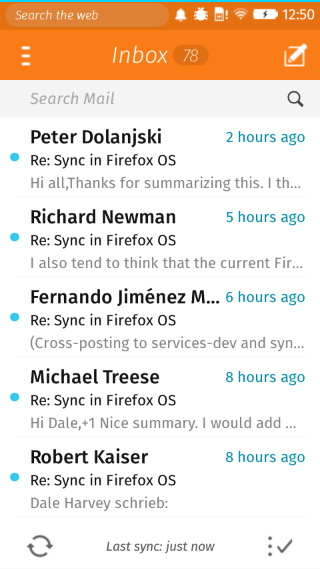
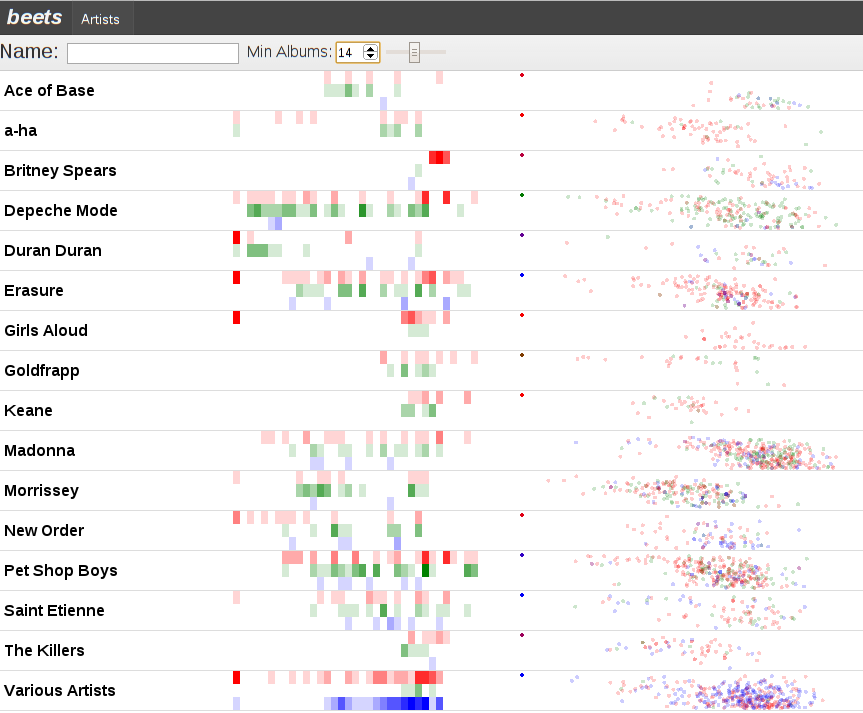
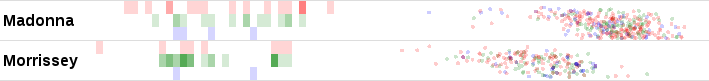
The cool screenshot above is of a SIMILE Exhibit-based faceting UI I created for bugzilla a while back which may help provide a more immediate concept of how faceting works. See my exhibit blog tag for more in the space.
Here are some example facets that search can soon support:
- Individual result paths: Categorize results by the path in which they happen. Do you not want to look at any results under
devtools/? Push a button and filter out all those devtool results in an instant! Do you only care aboutlayout/? Push a button and only see layout results! - Subsystem facets:
moz.buildfiles labels every file in mozilla-central so that it has an associated Bugzilla Component. As of Bug 1783761 searchfox now also derives a subsystem mapping from the bugzilla components, which really just means that if you have a component that looks like “Core :: Storage: IndexedDB”, searchfox transforms that first colon into a slash so we get “Core/Storage/IndexedDB”. This would let you restrict your results to “Core/Storage” without having to manually select every Storage bugzilla component or path by hand. - Symbol relationships: Did you search for a base class or virtual method which has a number of subclasses/overrides? Do you only care about some subset of the class hierarchy? Then restrict your results to whatever the portion of the set you care about.
- Recency of changes: Do you only care about seeing results whose blame history indicates it happened recently? Can do! Or maybe you only want to see code that hasn’t been touched in a long time? Uh, that might work less well until we improve the blame situation in Bug 1517978, but it’s always nice to have something to dream about.
- Code coverage: Only want to see results that runs a lot under our tests? Sure thing! Only want to see results that seem like we don’t have test coverage for? By looking at the result you’re now morally obligated to add test coverage!
Key to this enhancement is that the faceting state will be reflected in the URL (likely the hash) so that you can share it or navigate forward and back and the state will be the same. It’s all too common on the web for state like this to be local to the page, but key to my searchfox vision is that URLs are key. If you do a lot of faceting, the URL may become large an unwieldy, but continuing in the style of :arai‘s fantastic work on Bug 1769936 and follow-ups to make it easy to get usable markdown out of searchfox, we can help wrap your URL in markdown link syntax so that when you paste it somewhere markdown-aware, it looks nice.
Additional Query Constraints
A bunch of those facets mentioned above sound like things that it would be neat to query on, right? Maybe even put them in a preset that you can share with others? Yes, we would add explicit query constraints for those as well, as well as to provide a way to convert faceted query results into a specific query that does not need to be faceted in Bug 1799805.
A variety of other additional queries become possible as well:
- Searching for lines of text that are near each other, or not near each other, or maybe both inside the same argument list.
- Locating member fields by type (Bug 1733217), like if you wanted to find all member fields that are smart or raw pointer references to
nsILoadInfo. - Bug 1779340: Function/method argument list magic.
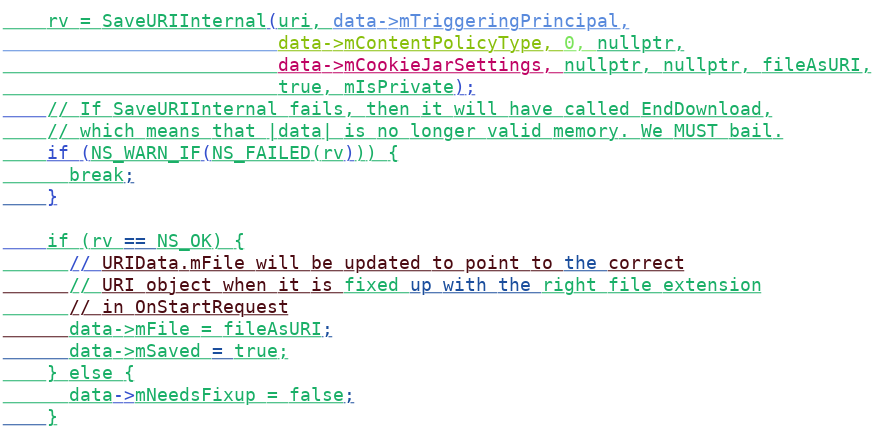
Result Context Lines For All Result Types, Including Automatic Context
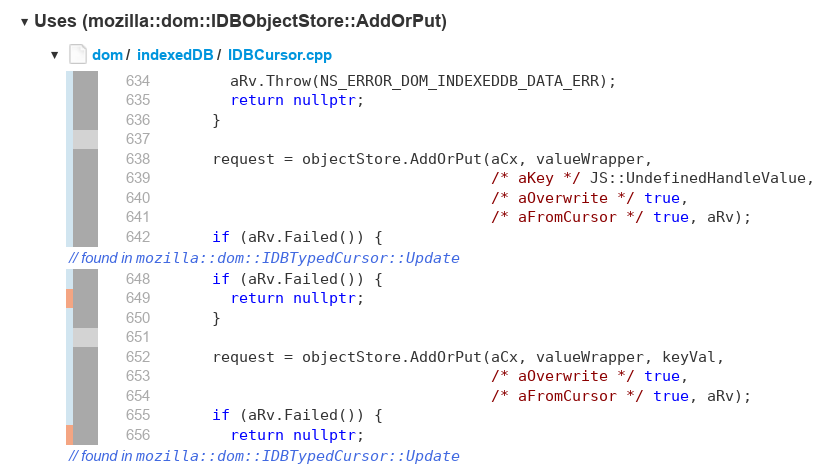
C:4 AddOrPutA major limitation for searchfox searches has been a lack of support for context lines. (Disclaimer: in Bug 1414954 I added secret support for fulltext-only queries by prefixing a search with context:4 or similar, but you would then want to force a fulltext query like context:4 text:my actual search or context:4 re:my.*regexp[y]?.*search.) The query mechanism already supports full context, as the above screenshot is taken from the query for C:4 AddOrPut but note that the UX needs more passes and the gathering mechanism currently needs optimization which I have a WIP for in Bug 1794177
Diagrams
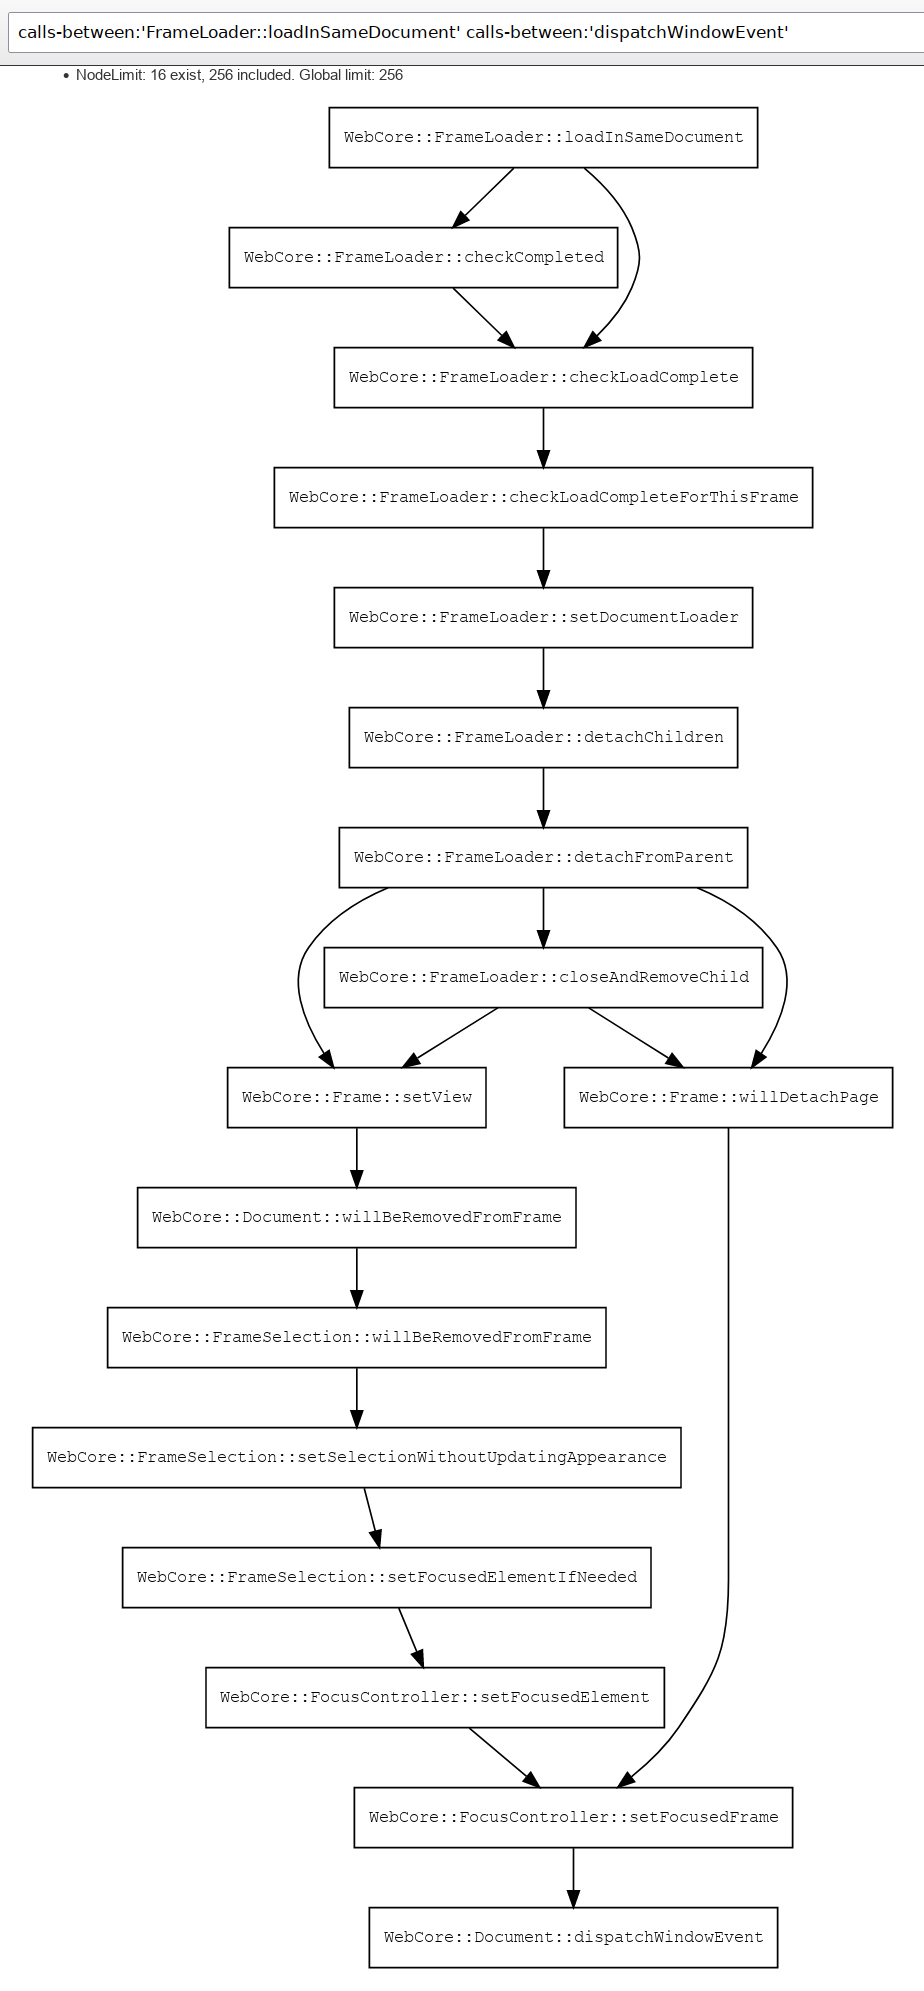
The above is a screenshot of a live diagram I just generated with the query calls-between:’WebCore::FrameLoader::loadInSameDocument’ calls-between:’WebCore::Document::dispatchWindowEvent’ against our searchfox index of webkit.
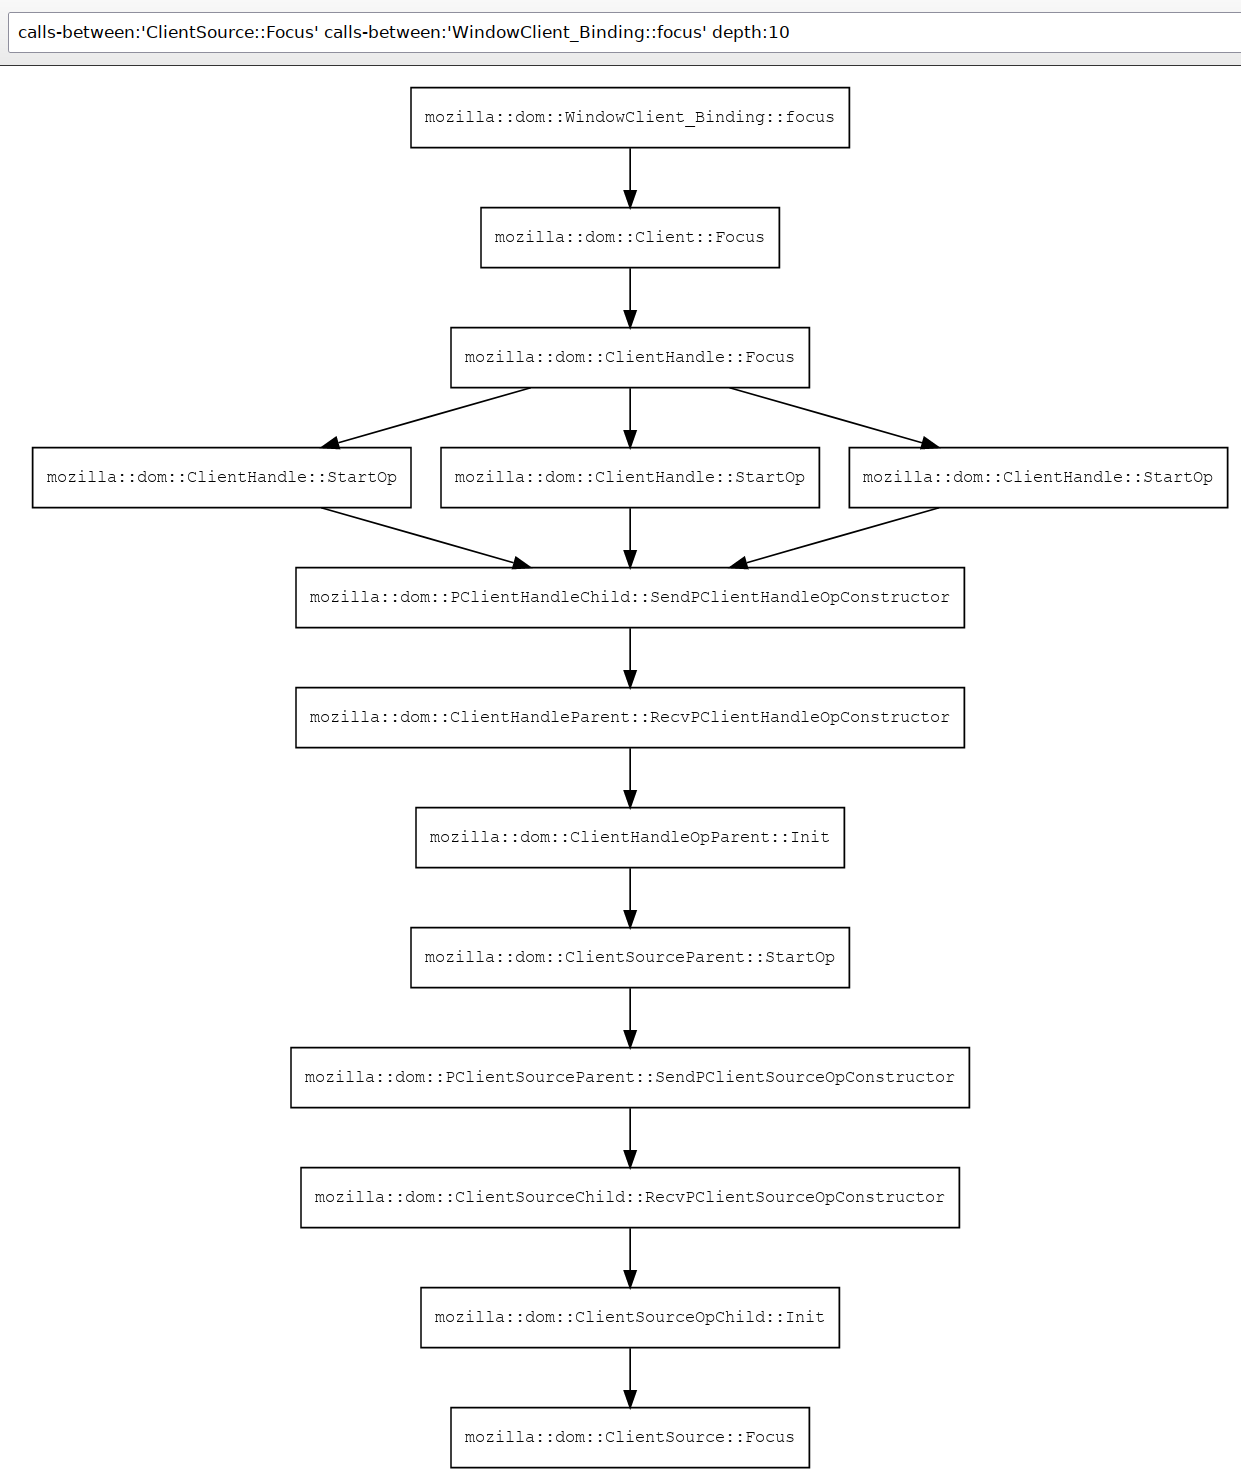
This next diagram is a screenshot of a live diagram from mozilla-central I just generated with the query calls-between:’mozilla::dom::ClientSource::Focus’ calls-between:’mozilla::dom::WindowClient_Binding::focus’ depth:12 and which demonstrates searchfox’s understanding of our IPDL bindings, as each of the SendP*/RecvP* pairs is capturing the IPC semantics that are only possible because of searchfox’s understanding of both C++ and IPDL.
The next steps in diagramming will happen in Bug 1773165 with a focus on making the graphs interactive and applying heuristics related to graph clustering based on work on the “fancy branch” prototype and my recent work to derive the sub-component mapping for files that can in turn be propagated to classes/methods so that we can automatically collapse edges that cross sub-component boundaries (but which can be interactively expanded). This has involved a bit of yak-shaving on Bug 1776522 and Bug 1783761 and others.
Note that we also support calls-to:'Identifier' in the query endpoint as well, but the graphs look a lot messier without the clustering heuristics, so I’m not including any in this post.
Most of my work on searchfox is motivated by my desire to use diagrams in system understanding, with much of the other work being necessary because to make useful diagrams, you need to have useful and deep models of the underlying data. I’ll try and write more about this in the future, but this is definitely a case where:
- A picture is worth a thousand words and iterations on the diagrams are more useful than the relevant prose.
- Providing screen-reader accessible versions of the underlying data is fundamental. I have not yet ported the tree-dual version of the diagram logic from the “fancy” branch and I think this is a precondition to an initial release that’s more than just a proof-of-sorta-works.
Documentation Integration
Our in-tree docs rendered at https://firefox-source-docs.mozilla.org/ are fantastic. Searchfox cannot replace human-authored documentation, but it can help you find them! Have you spent hours understanding code only to find that there was documentation that would help clarify what was going on only after the fact? Bug 1763532 will teach searchfox to index markdown so that documentation definitions and references show up in search and that we can potentially expose those in context menus. Subsequent steps could also index comment contents.
Bug 1458882 will teach searchfox how to link to the rendered documentation.
Improved Language Support
New Language Support via SCIP
With the advent of LSIF and SCIP and in particular the work by the team at sourcegraph to add language indexing built on existing analysis tools, there is now a tremendous amount of low hanging fruit in terms of off-the-shelf language indexing that searchfox can potentially ingest. Thanks to Emilio‘s initial work in Bug 1761287 we know that it’s reasonably straightforward to ingest SCIP data from these indexers.
For each additional language we want to index, we expect the primary effort required will be to make the indexer available in a taskcluster task and appropriately configure it to index the potentially many component roots within the mozilla-central mono-repo. There will also be some searchfox-specific effort required to map the symbols into searchfox’s symbol namespace.
Specific languages we can support (better):
- Javascript / Typescript via scip-typescript (Bug 1740290): scip-typescript potentially allows us to expose the same enhanced understanding of JS code, especially module-based JS code, that you experience in VS code, including type inference/extraction from JSDoc. Additionally, in Bug 1775130 we can leverage the amazing eslint work already done to bring enhanced analysis to more confusing situations like our mochitests which deal with more complex global situations. Overall, this can allow us to move away from searchfox’s current “soupy” understanding of JS code where it assumes that all the JS it ever sees is running in a single global.
- Python via scip-python (Bug 1426456)
- Java / Kotlin via scip-java (Bug 1490144)
Improved C++ Support
Searchfox’s strongest support is for C++ (and its interactions with XPIDL and IPDL), but there is still more to do here. Thankfully Botond is working to improve C++ template handling in Bug 1781178 and related bugs.
Other enhancements:
- Bug 1419018: Allow distinguishing LHS/RHS usages of fields, with a prototype of relevance in Bug 1733217.
Improved Mozilla-Specific Language Support
mozilla-central contains a number of Mozilla-specific Interface Definition Languages (IDLs) and Domain Specific Languages (DSLs). Searchfox has existing support for:
- XPIDL
.idlfiles: Our C++ support here is pretty good because XPIDL files are not preprocessed (beyond in-language support of#includeand the ability to put pass-through C++ code including preprocessor directives inside%{C++and%}demarcated blocks. Bug 1761689 tracks adding support for constants/enums which is not currently supported, and I have WIPs for this. Bug 1800008 tracks adding awareness of the rust bindings. - IPDL
.ipdland.ipdlhfiles: Our C++ support here is good as long as the file is not pre-processed and the rust IPDL parser hasn’t fallen behind the Python parser. Unfortunately a lot of critical files like PContent.ipdl are pre-processed so this currently creates massive blind-spots in searchfox’s understanding of the system. Bug 1661067 will move us to having the Python parser/code generator emit data searchfox can ingest
Searchfox has planned support for:
- WebIDL
.webidlfiles: Bug 1416899 tracks indexing WebIDL files, and Bug 1525189 tracks the JS interaction side of this. - StaticPrefList.yaml and related preference bindings: Bug 1699048 with discussion in Bug 1727789 on which it certainly depends.
- Taskcluster Taskgraph files: Bug 1800016.
Pernosco Integration
Searchfox’s language indexing is inherently a form of static analysis. Consistent with the searchfox vision saying that “searchfox is not the only tool”, it makes sense to attempt to integrate with and build upon the tools that Firefox engineers are already using. Mozilla’s code-coverage data is already integrated with searchfox, and the next logical step is to integrate with pernosco, why not. I created pernosco-bridge as an experimental means of extracting data from pernosco and allowing for interactive visualizations.
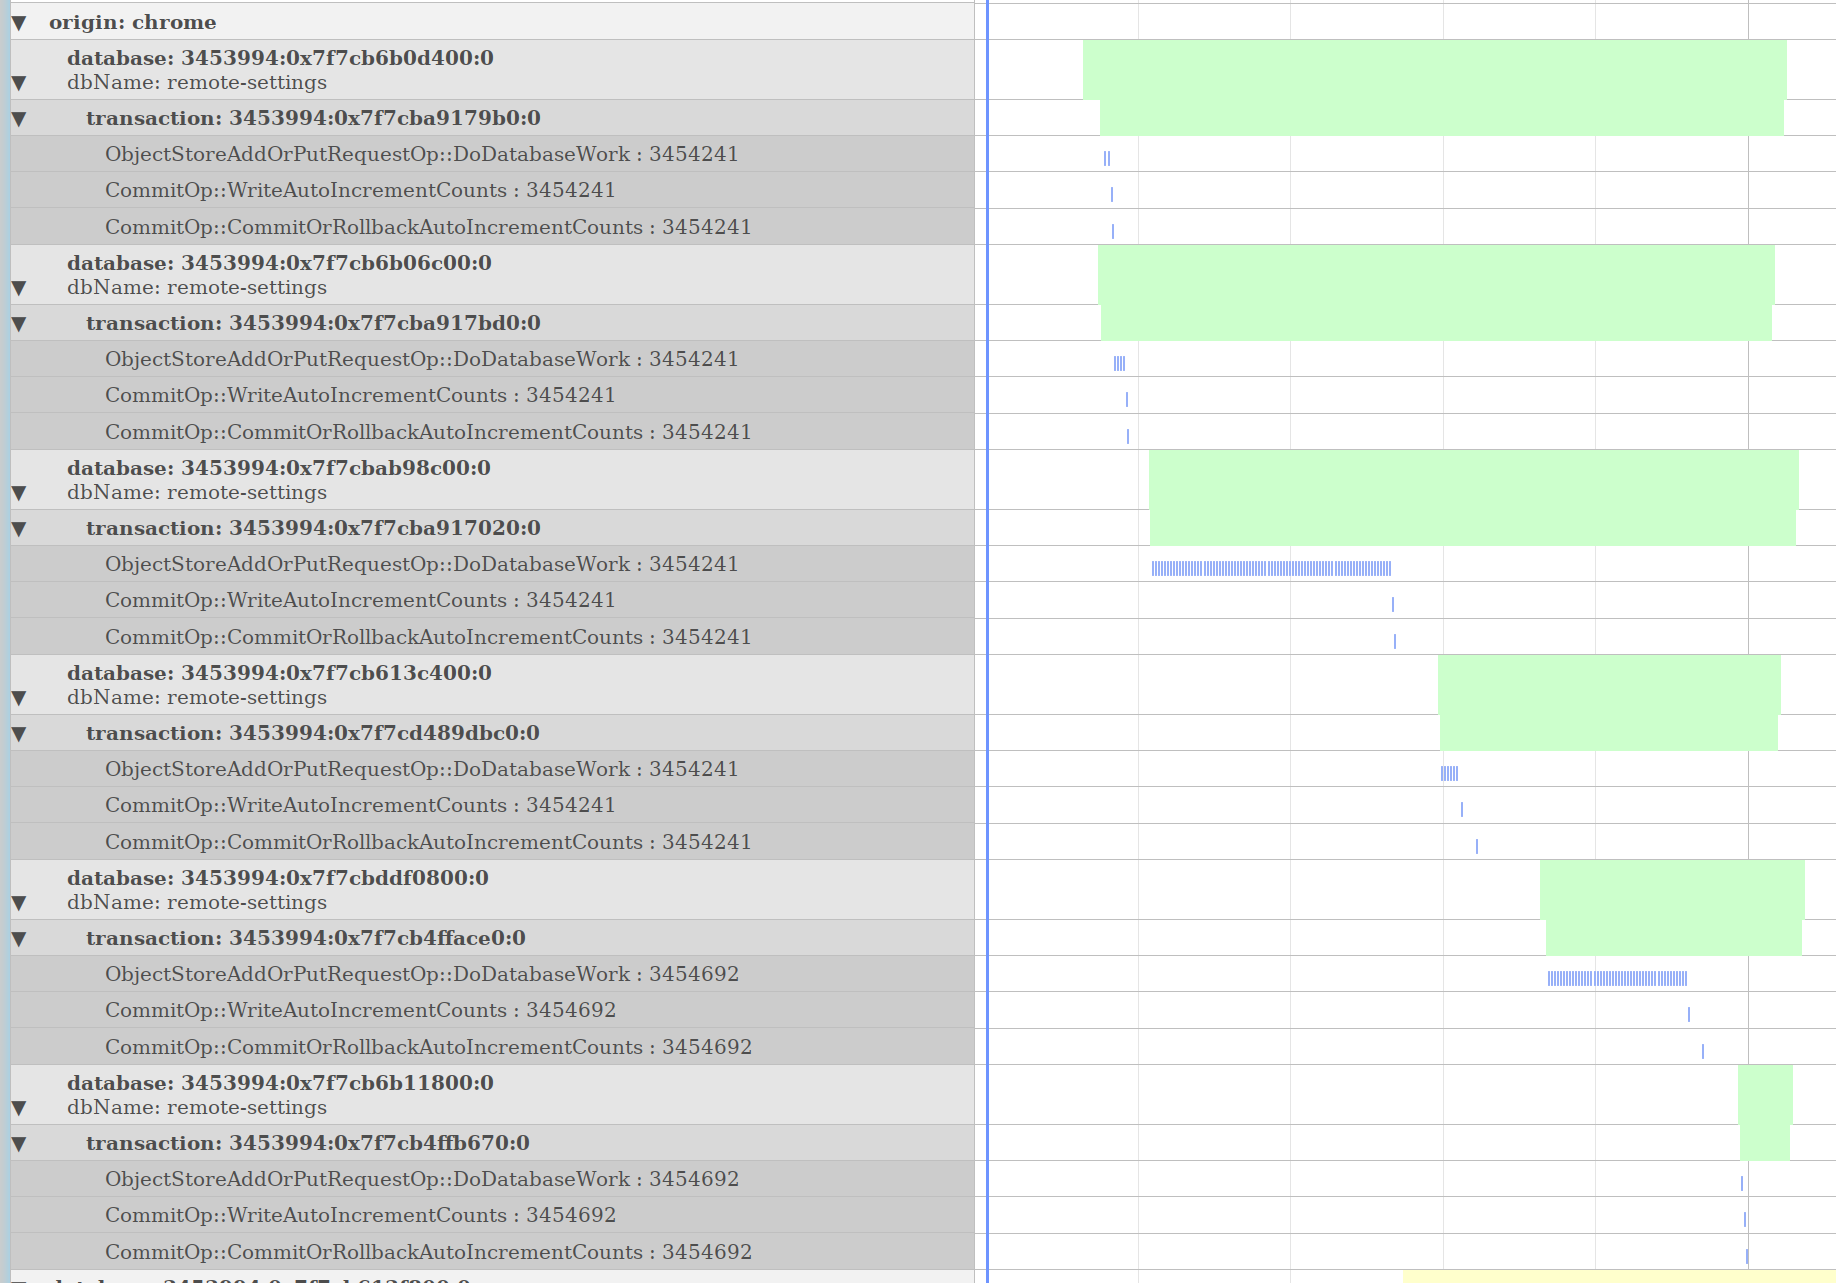
The screenshot above is an example of a timeline graph automatically extracted from a config file to show data relevant to IndexedDB. IndexedDB transactions were hierarchically related to their corresponding database and the origin that opened those databases. Within each transaction, ObjectStoreAddOrPutRequestOp and CommitOp operations are graphed. Clicking on the timeline would direct the pernosco tab to jump to those instants in time.
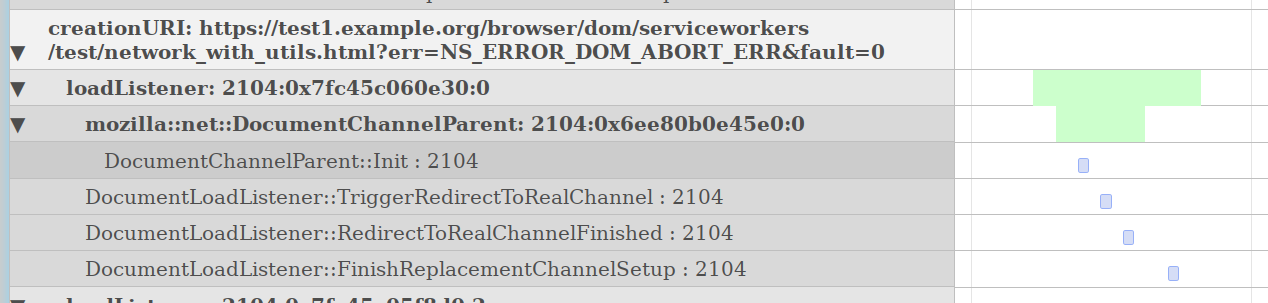
The above is a different visualization based on a config file for DocumentChannel to help group what’s going on in a pernosco trace and surface the relevant information. If you check out the config file, you will probably find it inscrutable, but with searchfox’s structured understanding of C++ classes landed last year in Bug 1641372 we can imagine leveraging searchfox’s understanding of the codebase to make this process friendly. More importantly, there is the potential to collaboratively build a shared knowledge base of what’s most relevant for classes, so everyone doesn’t need to re-do the same work.
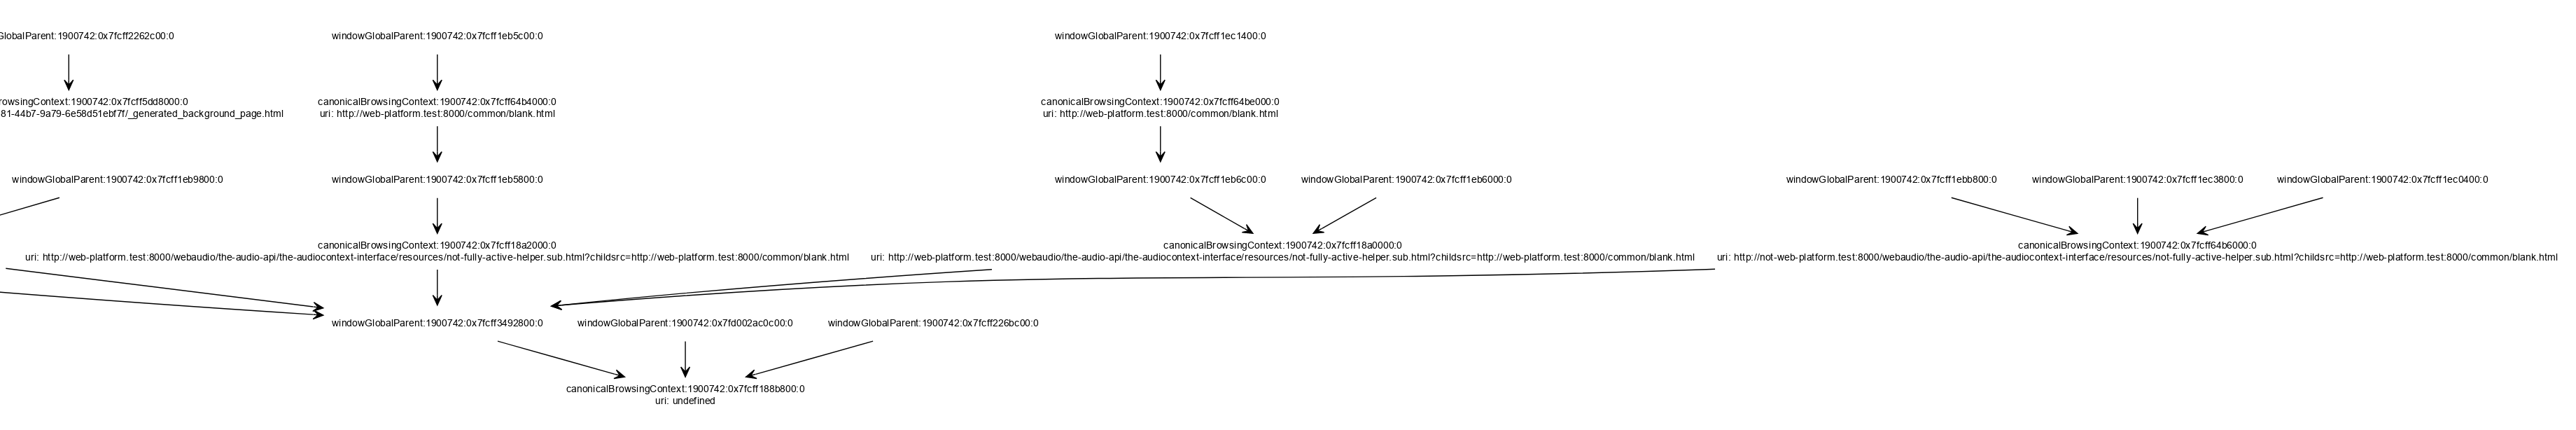
Using the same information pernosco-bridge used to build the hierarchically organized timelines above with extracted values like URIs, it can also build graphs of the live objects at any moment in time in the trace. Above we can see the relationship between windowGlobalParent instances and their corresponding canonicalBrowsingContexts, plus the URIs of the canonicalBrowsingContexts. We can imagine using this to help visualize representative object graphs in searchfox.
We can also imagine doing something like the above screenshot from my prior experiment pecobro where we interleave graphs of function activity into source listings.
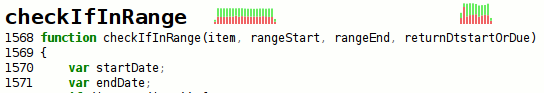
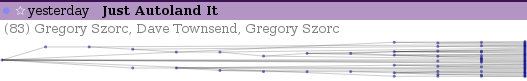
Token-Centric Blame / “hyperannotate” Support via Microannotate
Quoting my dev-platform post about the unfortunate removal of searchfox’s first attempt at blame-skipping: “Revision history and the “annotate” / “blame” UIs for revision control are tricky because they’re built on a sequential, line-centric data-model where moving a function above another function in a file results in a destructive representational decision to treat one function as continuing through history and the other function as removed and then re-added as new code. Reformatting that maintains the overall sequence of tokens but changes how they are distributed across multiple lines also looks like removal of all of the old code and the addition of new code. Tools frequently perform heuristic-based post-passes to help identify intra-line changes which are reflected in diff UIs, as well as (entire) lines of code that are copied/moved in a revision (ex: Phabricator does this).”
The plan to move forward is to move to a token-centric approach using :marco‘s microannotate project as tracked in Bug 1517978. We would also likely want to combine this with heuristics that skip over backout pairs. The screenshot at the top of this section is of example output for nsWebBrowserPersist.cpp where colors distinguish between different blame revision origins. Note that the addition of specific arguments can be seen as well as changes to comments.
Source Listings
- Bug 1781179: Improved syntax and semantic highlighting in C++ for the tip/head indexed revision.
- Bug 1583635: Show expansion of C++ macros. Do you ever look at our XPCOM macrology and wish you weren’t about to spend several minutes clicking through those macros to understand what’s happening? This bug, my friend, this bug.
- Bug 1796870: Adopt use of tree-sitter as a tokenizer which can improve syntax highlighting for other languages as well as position: sticky context for both the tip/head indexed revision but also for historical revisions!
- Bug 1799557: Improved handling of links to source files that no longer exist by offering to show the last version of the file that existed or try and direct the user to the successor code.
- Bug 1697671: Link resource:// and chrome:// URLs in source listings to the underlying source files
- Test Info Boxes
- Bug 1785129: Add an info box mechanism to indicate the need for data collection review (“data review”) in info boxes on searchfox source listing pages
- Bug 1797855: Joel Maher and friends have been adding all kinds of great test metadata for searchfox to expose, and soon, this bug shall expose that information. Unfortunately there’s some yak shaving related to logging that remains underway.
- Bug 1797857: Extend the “Go to header file”/”Go to source file” mechanism to support WPT `.headers` files and xpcshell/mochitest `^headers^` files.
Alternate Views of Data
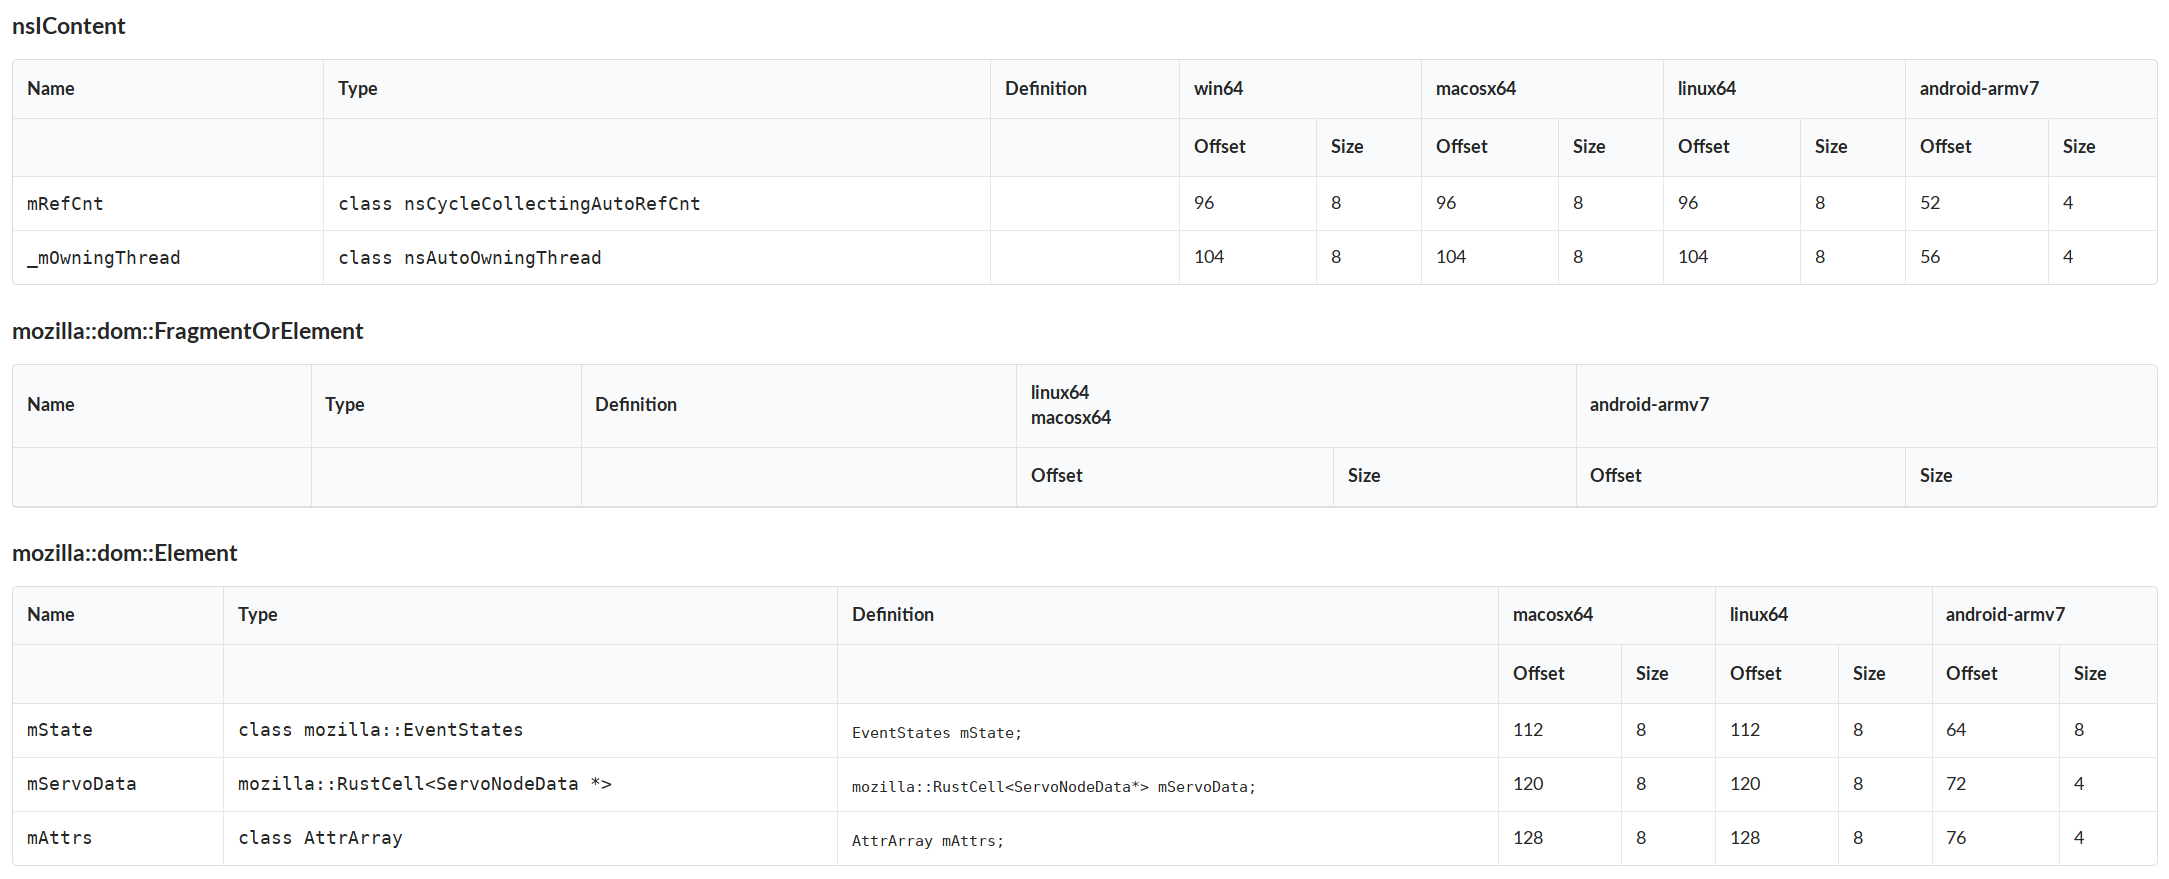
Searchfox is able to provide more than source listings. The above screenshot shows searchfox’s understanding of the field layouts of C++ classes across all the platforms searchfox indexes on as rendered by the “fancy” branch prototype. Bug 1468445 tracks implementing a production quality version of this, noting that the data is already available, so this is straightforward. Bug 1799517 is a variation on this which would help us explicitly capture the destructor order of C++ fields.
Bug 1672307 tracks showing the binary size impact of a given file, class, etc.
Source Directory Listings
In the recently landed Bug 1783761 I moved our directory listings into rust after shaving a whole bunch of yaks. Now we can do a bunch of queries on data about files. Would you like to see all the tests that are disabled in your components? We could do this! Would you like to see all the files in your components that have been modified in the last month but have bad coverage? We could also do that! There are many possibilities here but I haven’t filed bugs for them.
- Bug 1543707: Add README.md support to directories
Mozilla Development Workflow Improvements
- Bug 1732585: Provide a way to search related (phabricator revision) review/bugzilla comments related to the current file
- Bug 1657786: Create searchfox taskcluster mode/variant that can run the C++ indexer only against changed files for try builds / phabricator requests
- Bug 1778802: Consider storing m-c analysis data in a git repo artifact with a bounded history via `git checkout –orphan` to enable try branch/code review features and recent semantic history support
Easier Contributions
The largest hurdle new contributors have faced is standing up a virtual machine. In Bug 1612525 we’ve added core support for docker, and we have additional work to do in that bug to document using docker and add additional support for using docker under WSL2 on Windows. Please feel free to drop by https://chat.mozilla.org/#/room/#searchfox:mozilla.org if you need help getting started.
Deeper Integration with Mozilla Infrastructure
Currently much of searchfox runs as EC2 jobs that exists outside of taskcluster, although C++ and rust indexing artifacts as well as all coverage data and test info data comes from taskcluster. Bug 1598502 tracks moving more of searchfox into taskcluster, although presumably the web-servers will still need to exist outside of taskcluster.


 about:memory session")


