
We’ve been overhauling the Firefox OS Gaia Email app and its back-end to understand email conversations. I also created a react.js-based desktop-ish development UI, glodastrophe, that consumes the same back-end.
My first attempt at summaries for glodastrophe was the following:
The back-end derives a conversation summary object from all of the messages that make up the conversation whenever any message in the conversation changes. While there are some things that are always computed (the number of messages in the conversation, whether there are any unread messages, any starred/flagged messages, etc.), the back-end also provides hooks for the front-end to provide application logic to do its own processing to meet its UI needs.
In the case of this conversation summary, the application logic finds the first 3 unread messages in the conversation and stashes their date, author, and extracted snippet (if any) in a list of “tidbits”. This also is used to determine the height of the conversation summary in the conversation list. (The virtual list is aware of a quantized coordinate space where each conversation summary object is between 1 and 4 units high in this case.)
While this is interesting because it’s something Thunderbird’s thread pane could not do, it’s not clear that the tidbits are an efficient use of screen real-estate. At least not when the number of unread messages in the conversation exceeds the 3 we cap the tidbits at.
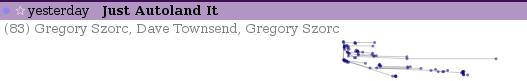
But our app logic can actually do anything it wants. It could, say, establish the threading relationship of the messages in the conversation to enable us to make a highly dubious visualization of the thread structure in the conversation as well as show the activity in the conversation over time. Much like the visualization you already saw before you read this sentence. We can see the rhythm of the conversation. We can know whether this is a highly active conversation that’s still ongoing, or just that someone has brought back to life.
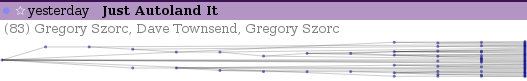
Here’s the same visualization where we still use the d3 cluster layout but don’t clobber the x-position with our manual-quasi-logarithmic time-based scale:
Disclaimer: This visualization is ridiculously impractical in cases where a conversation has only a small number of messages. But a neat thing is that the application logic could decide to use textual tidbits for small numbers of unread and a cool graph for larger numbers. The graph’s vertical height could even vary based on the number of messages in the conversation. Or the visualization could use thread-arcs if you like visualizations but want them based on actual research.
If you’re interested in the moving pieces in the implementation, they’re here:
Very cool.
About thread visualizations, this IBM article is seminal but was not followed up a lot. Too much screen real estate? not sure. I wonder even if because this article was so successful that it didn’t block any further development/imagination.
Some exploration there too
https://medium.com/@chantastique/design-concept-visualizing-conversation-50fb45cd2522
In thread visualizations, there should be ways to filter in/filter out depending on context: Only on this hour, this date, only this person A and B, not this person A, etc. By adding simple ways of rearranging the thread we can highlight things which matter to us.
Another crazy thought experiment but instead of just visualizing the thread if the messages were also readable in a 2D space larger than the screen and scrollable (with zoom in/zoom out) connected by the line (a kind of Google Maps viz) for emails I wonder what would it give.
Great link, thank you! One similar goal I’ve had is improving our quoting-detecting logic to also be able to link quoted blocks back to their original blocks. This could enable us to build a “unified” view of the content and its replies. The result would ideally be like what you’d expect in the Google/Apache Wave (idealized) model of communication. That, of course, would only work in situations where conversation participants make a diligent effort to quote/excerpt what they are referencing. I think in the forums model of that post, that may be the case!
In terms of a larger 2d space, I definitely agree that would be interesting. I was definitely considering using the same base d3 layout to attempt such a thing. And now, as I try to rationalize how that would be too much work, I realize it could also be pretty easy to whip up a proof-of-concept. (Which is admittedly all these things are at this time.) So perhaps I’ll try that now.
Re: filtering, absolutely agreed. I was very proud of what we accomplished with Thunderbird’s faceted search (see https://www.visophyte.org/blog/2009/09/03/sos-your-facet-faceted-global-search-for-mozilla-thunderbird/ if you’re not familiar), and it’s my intent as I implement the revised search/filter functionality to support faceting and brushing/marking in sub-visualizations.