
This visualization is the result of an adapted visichron.py script (from my chronicle-recorder ‘chroniquery’ bindings) run against the output of a custom DTrace script (using the Mozilla JS providers) on OS X. It’s a proof-of-possibility rather than anything immediately useful.
The differences from the last visichron post (using chronicle-recorder as a back-end) are:
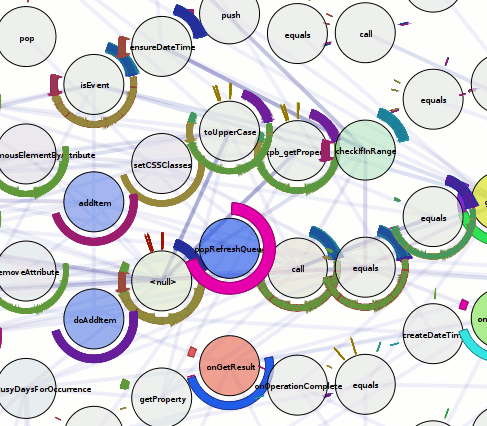
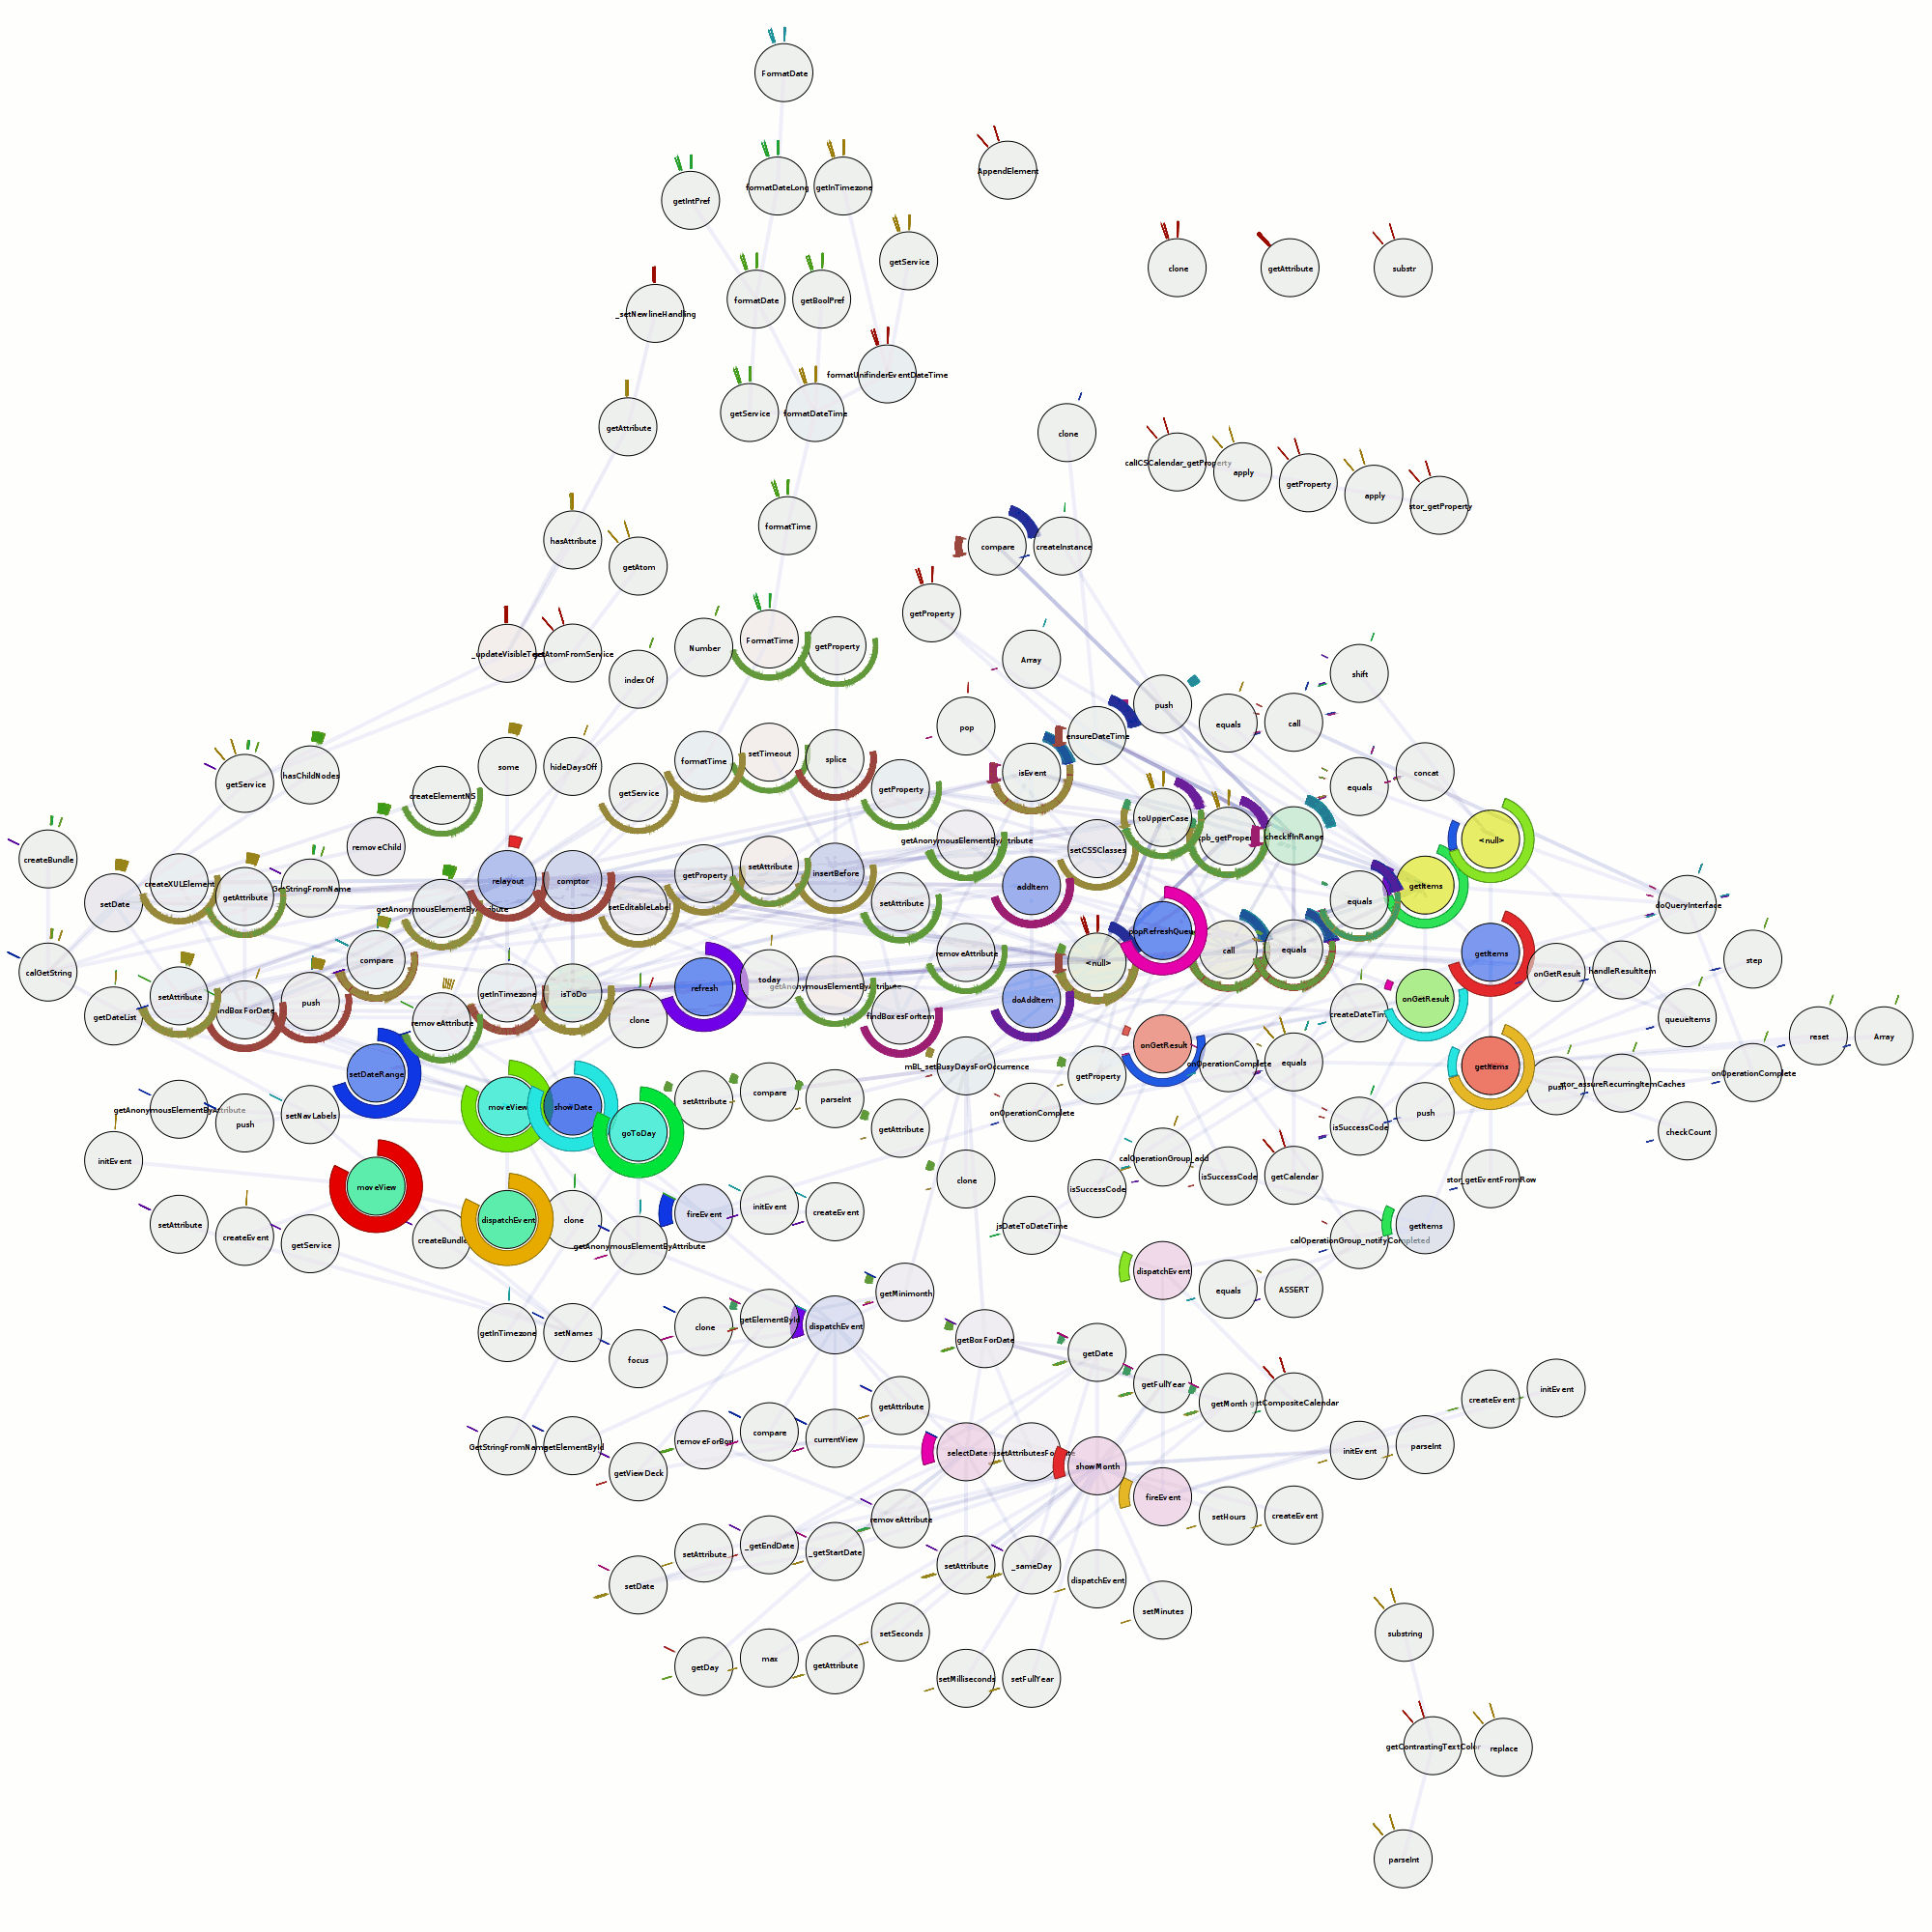
- Node hues are distinct based on the file the javascript was executed from. (Saturation still varies with amount of time spent in the function.)
- Graph layout is done using graphviz’s neato’s “ipsep” (experimental) mode. This works fantastically well at reducing/eliminating overlap. Having said that, a hierarchical layout may make more sense.
- Ring colors are based on call depth (so redundantly encoded with the ring radius) rather than any knowledge about the control-flow. Full control-flow information is not readily available and would be extremely expensive, but we could provide at least some degree of approximation using the calls made by the function as indicators. Of course, the ring visualization at this point and for this purpose is probably better represented as non-nested (side-by-side rings of different radii; not containing each other) faux-continuous ring slices with transparency varying by amount of time spent in the function at that call-depth. This would simplify the object model, allowing for non-insane use of the SVG backend and interactivity enhancements.
Pingback: visophyte: data made shiny :: pecobro: the performance code browser (early stage)