
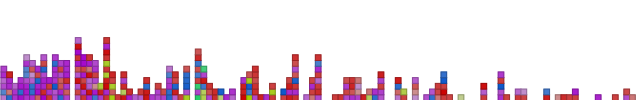
A visualization of the shoutbox traffic on www.frinkiac.org since the dawn of time or the blog, whichever came later. Colors are defined by the ‘shouting’ user (hue), the linearly scaled log of the word count of the contents (saturation), and a constant for value to get darker lines. So ‘brighter’ colors = longer shouts and ‘lighter’ colors = shorter shouts. All colors are regrettably ugly. The dawn of time is on the left, modern times is on the right. I think the clustering routine has decided each column is three days, although that may get a little shaky at the end of the months (quick-n-dirty date logic.)
This should look similar to…

ye olde KoalaRainbow 0.* for MovableType. The MTKR one is actually blog posts and comments and doesn’t distinguish based on the author, but the point is that I am beginning to be able to do all the things I used to be able to do. This helps flesh out the set of base visualizations and ensure that the architecture doesn’t have any obvious holes in things. Although the visophyte vis definition is perhaps still more verbose than I would like, it doesn’t make me lose hope like the procedural MTKR one did (click on the latter picture and scroll down to witness the ugliness).