
First, there’s bad news on the shiny front. Although I made the SVG renderer capable of producing the gel-like circles, Mozilla’s SVG support currently lacks the features to do it as implemented. (Curse your full-featured-ness, Eye of GNOME!) Hopefully someday soon, it will support the synthetic BackgroundImage filter input (bug).
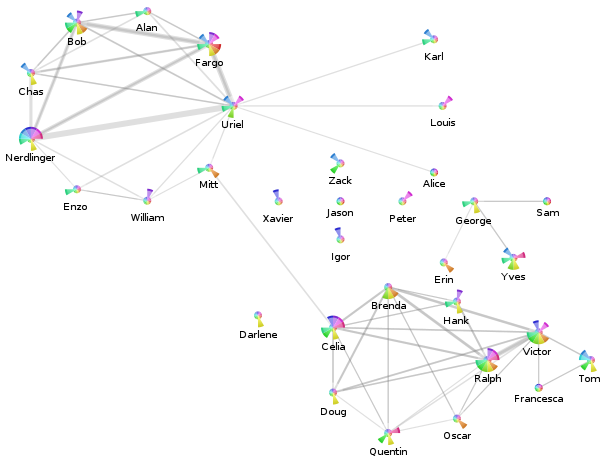
Our show-and-tell for the end of this weekend is a screenshot of the anonymized visualization from my Posterity contacts page for my ‘village’ tag (using my visterity plugin):
- The nodes represent the contacts tagged with ‘village’.
- The pie-slices represent the activity of the contact overall for the last year:
- Each pie slice corresponds to a month. The current month is the slice just below due east, and we go back in time as we rotate around clockwise. The oldest month is just above due east.
- The radius is a clamped linear scaling (over all nodes displayed and all months) of the number of messages sent by this person to anyone (including me).
- The color is just a consistent hue-variation designed to look pretty. I was actually planning to use a single color whose saturation was at max for the current month and decayed to black for the oldest month. That arguably would reduce confusion as to what pie slice means what.
- The labels are anonymized. There’s a mapper in there that maps people’s actual names (eventually nicknames) to what you see.
- The pie-slices represent the activity of the contact overall for the last year:
- The edges represent e-mail messages sent from the displayed contacts to the other displayed contacts. Since I did not add my contact to this label group, this means I have no impact on things.
- The edge widths are a linear scaling of the number of messages sent from the one contact to the other. Because the edges are actually directed, there may be two edges between two nodes which will overlap. Because the edges are not fully opaque, you should be able to figure out if the communication is at least symmetric or asymmetric.
Interestingly, you can see that the two major clusters of contacts are linked by ‘Mitt’ and ‘Celia’.
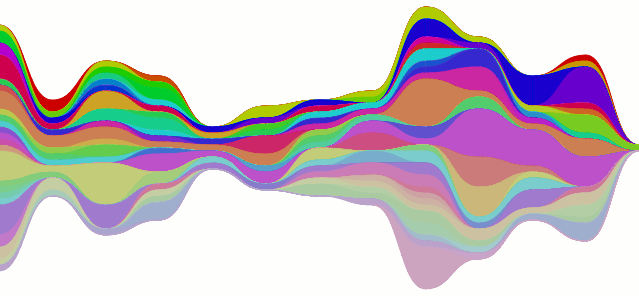
Er, so, every post gets two pictures, and there’s your second one. It’s the stacked line-chart being all curvy instead of not (curvy). The data is from the mailman feed, although I don’t think it’s actually supposed to look like that… the colors could also use some work.